Quantcast
Channel: Balanced Scorecard Software – BSC Designer
Viewing all 184 articles
Browse latest View live

The Difference Between Strategy Scorecard and Project Management Software

$
0
0

When talking to prospective clients we often hear comments like:

“I’m looking for a Balanced Scorecard software where I can assign a due date to my goal task, build a Gantt chart and add milestones…”

It looks like there is some confusion between the solutions for the project management and strategy scorecards. One is not a replacement for the other, and in this article, I’ll show you how they can complement each other.

Strategy scorecard software vs. project management software

The shared benefits of strategy execution and PM software

Let’s start with what project management and strategy scorecards have in common:

  • Accountability. In both cases, we want to know who is responsible for a certain task or goal, respectively both type of tools will give this required information.
  • Visual picture wins. In both cases if you have a good visual picture of what’s going on (strategy map or Gantt diagram) you will be able to make decisions easier.
  • Transparency. A common trend is fighting with informational silos, both types of software will provide you with the required collaboration functionality.
  • Protecting sensitive data. In some cases, there is a need to limit access to certain data, in this case the PM or strategy execution solution will normally give you a way to set access rights. For example, in BSC Designer you can set specific access rights on the level of scorecards and/or indicators.

Now, what about the differences?! Let’s have a look at the key parts of both types of solutions.

Gantt Chart vs. Strategy map

Gantt chart is a must for any project management software, but you will rarely find it in strategy execution tools. The reason is that in the contrast from a project, a strategy is never a fixed plan. Strategy is an educated hypothesis and a time-proven tool in the case of strategy is a strategy map.

But they still have one important thing in common:

  • On the Gantt chart elements that form a project schedule are linked with each other to illustrate the dependencies between the activities
  • On the strategy map, there are similar dependencies, that illustrate the cause-and-effect logic between business goals

Due dates vs. KPIs

Due date are the key metrics for the project management.

  • When an execution road map is plain enough we can plan accordingly: invest $X and you can expert in Y days to obtain the desired results.
  • When the road map has many curves and uncertainties we have to use more metrics (Key Performance Indicators) to make sure we are on the right track.

Some indicators from the strategy map will be powered by the metrics from the project management system.

Milestones vs. Targets

Milestones in the project management paradigm give us a clear understanding of where our project is compared to the previously approved plan. In the case of strategy execution we use a similar tool – target values for the performance indicators.

Tasks vs. Initiatives

In the strategy scorecard’s tools the term “initiative” is used to describe action plans for the respective business goal. The details of that action plan can be easily formalized in the project management software.

What’s unique about strategy scorecard software?

A good one should be a platform for the discussions around strategy, it should give your team a big picture of what’s happening in your organization, why, and how what they are doing that is aligned with company’s big goals. It will help you to keep your focus on things that matter the most.

What’s unique about project management software?

It’s the best on the operational level. Daily management of the team might be a nightmare without a software that will keep track of the project steps. A project management software gives a more explicit way to manage resources than a strategy execution software does.

For example, the standard 4 perspectives of the Balanced Scorecard don’t include a “Resource” perspective. The topic of resources is normally explained in the supporting documentation, or in the budget initiatives aligned with business goals (that’s what you will find in BSC Designer).

Can we use just PM or strategy execution software?

According to my experience, it’s a good idea to split the roles between the tools. Actually, the choice of the tool should be your second priority, the first one is building the system that you are planning to automate with the software.

If you have a proper strategy definition, description, and execution system in your mind (and in the minds of your team members) then you can choose any software tool, or even start with just pen and paper. Whatever your choice is, I’m sure our BSC Designer will be on your short list.

Feel free to share your opinion in the comments block.


A Long List of Goals vs. a Strategy

$
0
0

There is nothing bad about having a long list of goals, it’s a good way to keep a record of interesting ideas and action plans. But still, any business needs a strategy. A strategy helps to keep a direction towards the “north.” A strategy helps to filter goals that don’t fit, and it gives  coherence to the ones that are left.

The Differences Between a List of Goals and a Strategy

Do you already have a strategy for your business? Keep reading and make a short self-test for your organization, probably there are things that you can improve.

1. The difference is not about the quantity

Having 100+ goals on your list doesn’t make them a strategy. A strategy might be just one simple idea about what you want (or don’t want) your business to be like. The purpose of the strategy is to give your team a shared vision, and explain how you want to achieve it.

2. The difference is not about the package

Phrases like “leveraging growth opportunities via leadership” make goals sound smarter, but they don’t help with a strategy formulation and execution. A good strategy is formed by clearly defined goals. The word “clearly” in this case means “no different interpretations.”

3. Strategy is formed by “strategic” goals (sorry for tautology)

Before we discussed the differences between strategic and operational goals. Most likely, a good strategy will be formed by “strategic” goals, e.g.:

  • goals focused on change, not just on improving things;
  • goals aligned with vision.

Some goals (we often call them operational goals) are just not big enough for the business in the long term.

4. A list of strategic goals is still not a strategy

The problem with strategic goals is that there are a lot of them, and most of them are excellent, but contradictory ideas:

  • You might want to enter Brazilian market, or
  • Implement a new CRM system that will do all marketing job for you, or
  • Attract funding from a venture funds and create another Uber.

Normally, you cannot do all this at the same time. A strategy brings some systematic approach to this chaos. Strategy is about choices, and to make those choices we need to take into account many factors:

  • What do our stakeholders want?
  • What value do we create or could create for our clients? How do we make money?
  • What threats and opportunities are there (a good old SWOT)?
  • Why are we in the current situation? What constraints do we have? What do our competitors do?
  • What are our priorities, goals, and how are they connected?

There are various frameworks to describe a strategy, and for sure Balanced Scorecard is one of the best and recognized.

5. To-do lists & Gantt charts vs. strategy maps 

The most valuable part of the BSC approach is a strategy map – make sure you have a good one for your strategy. There are two signs of a good strategy map:

  1. It actually exists (and you can show it to your employees)
  2. It is a few pages only (1 page for a map, 2-3 pages to explain the supporting ideas)

Having 80+ pages document and calling it “Organization’s strategy for 2050” is fine, but consider making an “executive summary” version of this document as well.

In this context, we often hear complains like “It’s hard to maintain a strategy scorecard in Excel/PowerPoint.” You can create a prototype of a strategy map in any office software, but for a real project I’d suggest using professional software like our BSC Designer.

What about keeping goals in order? The tool might be as simple as a list of things to do, or a professional project management software will Gantt charts and other useful functions.

Once more, before searching a software tool, get a clear understanding of what you are actually looking for. A typical confusion that we discussed before is when people are looking for strategy execution software, when they actually need a simple project management tool.

6. Goals are about actions; strategy is about actionable hypothesis

There is a less obvious difference between a list of goals and a strategy:

  • When we have a list of goals, in the many cases we have in mind a specific set of actions with the expected results.
  • In a case of strategy, we have a number of hypothesis that we want to try. Those hypotheses are for sure actionable, but the results are not guarantied.

7. The goals are the steps towards success; strategy is a road map towards the “North”

What was the purpose of designing a strategy? That’s a good question! Didn’t we create another document that will be used at annual meetings only?! I hope this won’t be the case!

Thinking about a strategy, a good analogy might be a history of writing. People were able to communicate before writing, moreover, they were able to share their ideas across generations, but having a formal way of writing multiplied the efficiency and effectiveness of the knowledge they were sharing.

A similar change happens in an organization that created and implemented a good strategy. The organization was able to work before without a strategy map or KPIs, but having a good strategy helps to explain it to all the employees (find some facts here for a case you need to convince your boss), and helps to understand the priorities, and the context.

Feel free to share your thoughts in the comments block below or ask some follow up questions.

Manage Business Goals with BSC Designer Online

$
0
0

A video introduction to the business goals in BSC Designer Online. With business goals function one can formalize business strategy and later visualize it automatically on the strategy map.

Learn how to:

  • Add perspectives and business goals
  • Assign strategic themes
  • Add initiatives
  • Align with leading and lagging KPIs
  • Do cascading by business goals
  • Control visibility of business goals on the strategy map

Account Administration in BSC Designer Online

$
0
0

This is a video manual that explain how to manage with account in BSC Designer Online. You will learn:

  • How to create a test account
  • How to switch from test to paid account
  • How to backup account projects and settings
  • How to change account’s logo and add new users

Dashboards in BSC Designer Online

$
0
0

This is a video manual that explain how to user Dashboards in BSC Designer Online. You will learn:

  • How to create a new dashboard
  • How to adjust chart’s settings for the time period and add more KPIs to the chart
  • How to add a new chart linked to the specific indicator
  • How to add a new chart linked to the item selected on KPIs tab
  • How to export your dashboard to the image file

Managing Users in BSC Designer Online

$
0
0

BSC Designer Online was created a multi-user platform. It allows different members of your team to work together on the same Balanced Scorecard or KPI Scorecard project. In this video we will explain how to manage users in your account:

  • The difference between “power” and “view-only” user
  • Checking out the number of allowed users
  • Enabling activity logs for the users

KPIs to Focus on During Holidays

$
0
0

Spend your marketing budget wisely, understand new consumer habits, and make sure your customer service is prepared – proper KPIs will help to keep focus.

Proper KPIs will help to keep an eye on business performance during holidays period

What are holidays from the business viewpoint? On one side the competition for the consumer’s attention is increasing, on the other side buyers need to wade through hundreds of offers, and buy the gifts on time. Below, I recommend some metrics; most likely you already have them on your business scorecards, during holidays it make sense to move them to your primary dashboard.

Why does one need to track metrics during holidays?

If you start using KPIs in December – don’t expect your holiday sales to increase in a moment. Why then should one bother about finding good metrics? Here are two good reasons:

  • To keep an eye on current operations to make sure everything is running smoothly
  • To gather data to better prepare for the next holiday season

The competition for the consumer’s attention starts long before the holidays, according to Google, 26% of shoppers start their research on the gifts before Halloween. If you want to be prepared for the next year, then start analyzing new consumer trends in your niche today.

Finance and marketing

Be prepared for higher costs for your marketing campaigns. For example, one of the research studies showed that the costs of Facebook advertising might increase 2.5 times during Black Friday. Obviously, something similar happens to other medias.

KPIs to track:

  • Marketing costs (for example, CPM/CPC for online businesses)
  • Customer Lifetime Value
  • Acquisition Costs

Action plan:

  • Make sure you balance your marketing budget, with customer lifetime value

Before we discussed some examples of Marketing and Sales strategies and KPIs.

Customer service

Holidays are a crash test for any customer service and logistic systems.

KPIs to track:

  • Response time
  • First call resolution rate
  • Customer satisfaction; NPS
  • On time delivery; website availability (more IT KPIs)

Action plan:

  • Map your business processes and find possible bottlenecks
  • Make sure you have indicators that will work as  early warning signals

In the previous article, we have discussed more strategies and metrics for the customer service department.

Understand new consumer’s habits

Here are some insights from Google’s Holiday Shopper Intentions research.

Be mobile-ready

More people will use their smart phones in store to find info on the product.

KPIs to track:

  • Mobile-friendly web pages, %
  • Time on site for mobile users

Action plans:

  • Mobile-friendly website is must
  • Analyze what info  customers need to see online: prices, availability, sizes

Gift guide video

More buyers will watch gift guide videos. If it is applicable for your niche, make sure you have a good one.

KPIs to track:

  • Positions of video in YouTube
  • Views during the holidays

Action plan:

  • Identify buyers’ needs and create a good gift guide video

You will find some more examples in the Content Marketing scorecard.

Gift card ready

With the overwhelming number of the competing offers available online and offline, make sure you have the simplest one – a gift card.

KPIs to track:

  • Gift card availability, %
  • # of gift cards bought during holiday season.

Keep your team engaged

The holiday period might be stressful for your team, make sure your managers do their best to keep the team engaged.

KPIs to track:

If you have an incentive program implemented for your team, make sure you have a pair of leading and lagging indicators to minimize the risk of KPIs misuse.

Useful tips for the users of BSC Designer

Below is some advice for the users of BSC Designer software, a professional tool to manage your KPIs and scorecards:

  • Create a separate strategy map to present your strategy for the holidays; use this strategy map to communicate your strategy to the team
  • Create a separate dashboard to visualize indicators mentioned in this article
  • Make sure you keep a holiday strategy map and dashboard to reuse it in future
  • Create Alerts to get notifications in a case  some important KPI bends up in the red zone

How do you measure the performance during holiday seasons? Feel free to share your thoughts in the comments.

KPIs Misuse: Why Does It Happen and How Avoid It

$
0
0

As with any other business tool, Key Performance Indicators have disadvantages, one of them is a possible misuse of KPIs. You set up some good metrics, but soon you find out that your employees have found a way to game the system. Instead of doing what you expect them to do, they have found a loophole to get KPIs into the green zone without doing what your business actually needs. 

KPIs Misuse: Why Does It Happen and How Avoid it

Gaming KPIs is a Big Problem

The recent case with Wells Fargo where at least 5,300 employees were involved in opening sham accounts and getting credit for meeting their sales goals just confirms how big this problem might be.

You might find a call center where employees are calling to each other just to keep their “Number of calls” indicator in the green zone, or a web marketing specialist who drives traffic to a website without caring much about its quality.

In the Soviet Union the effectiveness of their railway system was measured using a “ton/kilometer” metric. And the simplest way to keep this indicator in the green zone was to move shipping containers across the country without any particular need.

The list goes on, and if you know some good examples, feel free to share them in the comments.

Why do KPI Failures Like This Happen?

I’m sure there are some cases that happen because of the bad side of human nature, but in the majority of cases we need to blame management. The typical reasons are:

  • Pushing employees too hard towards working for KPIs (KPI itself becomes a target)
  • Linking incentives to the KPIs and not validating them later
  • Inventing KPIs on the top and mandating them to the bottom, skipping the discussion phase
  • Setting the target value for an indicator, but not discussing an action plan
  • Focusing on the destination, but forgetting about quality/value aspect

To solve misuse problems, we need to address both technical and cultural issues. A technical one will work effectively only if the performance measurement culture is updated as well.

Technical Solution: Use “performance-value” or “performance-quality” pair

The technical solution is to use a pair of indicators, not just a single metric. This pair should be formed by:

  • Performance Indicator, and
  • Quality or Value Indicator.

For example, for the sales agents we might use:

  • Performance indicators: Accounts created
  • Quality indicator: Average account’s profit within a certain period of time

If a bank would use a similar pair of indicators instead of just one indicator, they would certainly be able to diagnose the problem of sham accounts at an early stage.

For the customer service specialist this might be:

  • Performance indicator: First call resolution rate
  • Value indicators: Returning problem rate; Net Promoter Score.

Is it possible to game a pair of indicators? It depends on the pair, but it is still possible. That’s why we need to address the problem on the cultural level as well.

  • If plan a long term change, I do recommend for you to check out this article about changing your performance measurement culture.

Cultural Solution: KPIs Are All About Discussion and Learning

Start with finding and eliminating bad behavior patterns:

  • Mandating KPIs top to bottom
  • Abusing KPIs in the command and control chain (just remember that KPI is the INDICATOR for the performance, not the PERFORMANCE)

Practice shows that KPIs work much better when:

  • They are the product of the discussion between the line-level employees and their managers
  • The KPI data is used as a base for another discussion, but not to blame someone for the bad results

KPIs and Incentives

I know many companies incorporate KPIs into their incentive plan. Everything looks logical at the first glance: there are bonuses that we want to pay, and we pay them only when a person hits certain targets. The thing is that by doing this a company is shifting a focus from a KPI as a learning tool (which it should be in a perfect case). In the previous article I shared my thoughts on the topic and discussed some best practices.

The Most Important Rule For the KPIs

Stop chasing KPIs: Focus on the value creation and the metrics that can help you to track the value.

What’s the Difference Between a Bad KPI and a Good One?

Good KPIs doesn’t come along; you need to have these parts:

  • A clear business goal behind all KPIs;
  • Performance driver indicator or leading indicator;
  • Result indicator;
  • Indicator related to the quality or to the value created;
  • An action plan that is aligned with indicators.

Good KPIs are normally accompanied by all these details, while the bad ones are not. It’s not  rocket science, but you need to follow certain steps when brainstorming your KPIs. Feel free to use our KPI 10-step system to find good KPIs for your business.

An Example: Discussion Around KPIs

Let’s take online marketing as an example. This is a kind of discussion that might happen between a marketing specialist and his/her manager:

  • Manager: We need to increase website traffic by 5%! {That’s where many managers stop their management efforts}
  • Marketing: What about using a content marketing approach?
  • Manager: Sounds great. How you are going to get it to work?
  • Marketing: We will start writing interesting articles and posting them on our website and on the social media. {Here is an action plan!}
  • Manager: The more articles you write the more visitors we have, right?
  • Marketing: It’s not that simple these days. Search engines care about people who search information online, so we need to make sure those articles are high quality ones, and address real users’ needs. {We know what performance indicator will be used – The number of articles, but it is not enough}
  • Manager: How can we make sure that these are high quality articles?
  • Marketing: We’ll need to study first the problems that our users deal with and find an expert on the topic who will be able to write about them. {This is where the value is created}
  • Manager: Once everything is done, how can we validate the results?
  • Marketing: We can track the number of visitors that were attracted by the new content!
  • Manager: And how do we know that those are our target users and that we created any value for them?
  • Marketing: We can track the social engagement metrics, time they spend reading the article, and track the conversion rate into our mail list and later into the sales. {That’s where we validate value created and quality achieved}
  • Manager: Now we have a complete picture! {This is not the end of the dialog, after a certain period the team will meet again to analyze the results achieved}

Here are the results of the discussion:

  • Business goal: attracting more qualified visitors to the website
  • Performance driver indicator: the number of articles published;
  • Quality/value indicators: conversion into mail list/sales; time on site; social engagement metrics;
  • Action plan: 1. Study customer’s problems; 2. Find an expert. 3. Write and publish content; 4. Analyze the results and improve.

I think readers would agree with two points:

  • For both parts, manager and the marketing guy, this approach to the goal/KPI works much better than just “Increase our website traffic by 5%.”
  • There is no sense in a marketing employee gaming the system and, for example, writing many poor-quality articles. That simply won’t work and the quality/value indicators will show that something is wrong.

Automation tools

If you want to follow this model, then instead of 2 columns with an indicator name and its value, your spreadsheet must be something more detailed:

  • First of all it is necessary to show a business context, preferably a strategy map;
  • Then more indicators need to be tracked, as well as an action plan;
  • And, you also need to keep a historical record of all performance data, as well as have a reminder to update and check indicators’ value regularly.

I’m sure Excel gurus can solve these tasks very well; the problem might come when someone else needs to update this spreadsheet…

An alternative way is using a professional software for business scorecards, like BSC Designer. There you will be able to:

  • Store a number of strategy maps to explain business context
  • Add various indicators and align them with your business goals
  • Assign a person responsible for an indicator
  • Track budget, initiatives, action plans related to the business goals
  • Specify preferred update interval for the indicators and make sure that the values were actually updated on time
  • Once it’s time to analyze the results, you can visualize all the data on the dashboards or in the performance reports

Give it a try! If you don’t like the idea, you can always export your data back into an Excel spreadsheet.

Conclusions

Here some key take-aways of the article:

  • KPI misuse is a big issue; any business is at risk
  • Focus your team on the value creation, not on the KPIs and respective targets
  • Be careful with incentives linked to the KPIs, they are shifting focus from learning
  • Make sure your performance KPI is paired with a value/quality indicator
  • The best KPIs are the product of the discussion
  • Prepare your culture for KPIs in the red zone: the best insights come from there

Strategy Maps in BSC Designer Online

$
0
0

Strategy maps are an excellent tool to visualize and communicate the strategy of the organization. Use BSC Designer to create professionally-looking maps that can be created automatically using the information about the business goals and the KPIs that you have in your scorecards. In this video you will learn:

  • How to build a Balanced Scorecard strategy map
  • The details about all map elements
  • How to create “Overview” map for the business goals
  • How to create “Geo” maps and align KPIs with geographical areas

Learn more about strategy maps in BSC Designer Online.

Analysis of the KPIs in BSC Designer Online

$
0
0

The “Analysis” tab in BSC Designer Online helps users to get insights about the performance of the indicators in the scorecard. In this video you will learn how to:

  • Find best/worst performing indicators
  • Forecast indicator’s value
  • Find the most important indicators
  • Find indicators that are the biggest gain/loss over the period of time.

Learn more about analysis function in BSC Designer Online.

Questions and Answers About KPIs

$
0
0

Questions and answers about the Key Performance IndicatorsBelow you will find some frequently asked questions about KPIs and my answers to those questions. Feel free to ask more questions in the comments in the end of this article.
“We are doing fine without any KPIs; do we need some?”

It’s like using a GPS in your car. When you drive the route that you are used to driving every day, then most likely you won’t turn a GPS on. Does it mean that you don’t need it in more complex situations, like for example, trying to find some street or checking out the latest traffic information? The same can be said about KPIs, the more complex your business environment is, the more you need good KPIs. You can find more examples in this article.

“Is “Implement new HR training program within 1 year” a good goal? Does it need a KPI?”

The goal in this case sounds more like a milestone or an action goal. In the end of the year one can give a “yes/no” answer to the question whether the program was implemented or not. The way that the goal is formulated now doesn’t imply an achievement of any performance results, so there is no sense in using key performance indicators. If you would focus on improving the efficiency of HR training programs, or reducing of the operational costs, then this could be a good performance goal, and respectively there can be used performance indicators.

“Is “Improve employee morale by 15%” a good goal? What KPI would you suggest for it?”

There is a known mantra that goals need to be specific and measurable, that’s why many of the goals incorporate the measurement part. That’s one of the possible approaches, but personally I prefer to divide the goal part and the measurement part. The goal in this case is to “Improve employee morale.” A morale index might be used a as a metric. Formulated in this way it makes much more sense.

“Is “Double employee productivity” a good goal? Do we need a KPI for it?”

Many companies have such goals on their scorecards in order to motivate their staff. For my opinion goals like this one have two major flaws:

  • The goal is unrealistic: why exactly do we need to double the productivity; why not increase it by 10% or 30% or by 12.75%?
  • It is not clear how to measure the productivity for tasks like marketing, software development, copywriting…?

“Do we need a software for our scorecard?”

It depends on how serious you are about KPIs. If you need to maintain KPIs in several perspectives, calculate their performance, take into account their relevant importance, visualize them on strategy maps, then I would go for some professional software.

I know some Excel gurus who can create a real state of the art scorecard, but the question is how hard is to maintain those scorecards. A freeware BSC Designer Light might be a good starting point.

“Is a KPI that I have “leading” or “lagging” one?”

These terms are contextual, one KPI is leading or lagging only in the context of a certain business goal, therefore in many cases there is a no clear difference between “leading” and “lagging.”

“What is a correct term: KPI, metric or indicator?”

When talking about terminology there is a difference. And for sure, it is a good idea to understand this difference and use the correct terms in each case. A practical experience; however, shows that the term “KPI” is used interchangeably. A minor metrics might be called a “KPI” and adds some confusion. To stay on the safe ground, I’d use “metric” or “indicator” as terms.

What KPI template do you recommend?”

Actually, none of them. There are some popular industry-standard KPIs, yes, they look very professional and they might be a good starting point, especially if your boss just wants you to “find some KPIs.” But the impact of a few tailor-made KPIs designed by your team for your business goals is much higher than the impact of 50+ KPIs found on the Internet.

“It feels like my team doesn’t accept new KPIs… Why?”

Two most typical reasons are:

  • Those KPIs are not aligned with real business problems.
  • The KPIs are not the product of the discussion.

“My employee allowed a KPI to move to the red zone. How should I react as a manager?”

In my opinion this situation is a chance to start a discussion about what can be done better in the future. That’s why we have KPIs: to understand our business better, to prevent problems in the early stages.

“How do we cascade KPIs across the company?”

While many automation softwares (including BSC Designer) support cascading by indicators, it makes much more sense to cascade business goals, and only then find relevant indicators for each level. We’ve discussed this in detail in this article.

“Do you recommend to use KPIs for bonus calculation?

If you do it to control your team in a “carrot-and-stick” style, believe me, they are cleverer than you are and they will find some ways to game the system. We have discussed possible approaches to this task in the previous article.

“What number of KPIs do you recommend to have on a scorecard?

If you passed though the steps described above, just a few KPIs will survive the process. Other will be deleted, or moved to the scorecards of the teams or individuals that work specifically on that problem. A good formula to have in mind is 1 business goals = 2 metrics (one leading/predictive and one lagging/result).

“We have 40+ metrics that we track only for marketing. What we are doing wrong?”

Nothing wrong with this, but I guess most of those metrics are not key performance indicators. Those are operational metrics. Getting back to the car analogy, you are checking all you see on the dashboard: oil level, engine temperature, traveled distance, the state of safety belt, and so on. Indicators are important, but when your goal is to get from point A to point B (execute a business strategy), then you need to focus your attention on a few KPIs. And the steps of the system help you to find those KPIs among many possible metrics.

“If you could give only one bit of advice about KPIs, what would you suggest?”

Create and carefully maintain a proper measurement culture in your organization!

Join KPI training and certification by BSC DesignerCovert separate pieces of information about Key Performance Indicators into new skills and actionable knowledge. Join "KPIs Training and Certification" by BSC Designer to learn our time-proven KPI system and get a lifetime access to the KPI training knowledge base.

More about KPI Training

Example of Using KPI Step-by-Step System

$
0
0

Good KPIs take into account business context, predict success, show early warning signals, validate achieved results, and for sure, they are accepted by your team. This time-proven system will guide you step-by-step towards excellent KPIs that are right for your business.

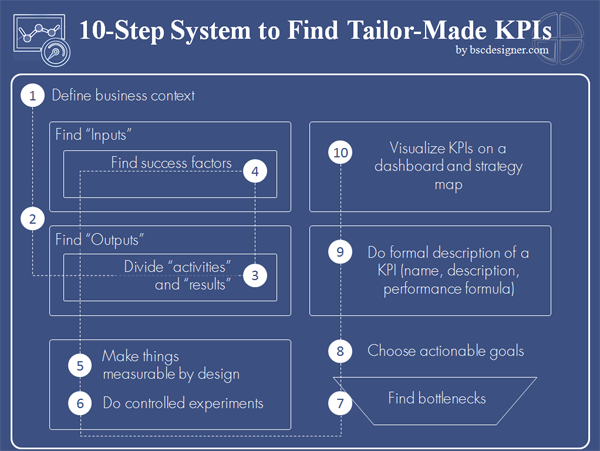
10-Step System to Find Tailor-Made Key Performance Indicators

The steps of the system are not presented in hierarchical order. Instead, I’m following the natural sequence of challenges and responses that our clients normally deal with, and I will illustrate them by the dialogs with Peter. Peter is not a real client, but he faces all the same problems with KPIs that most business professionals do.

Step 1. Define business context

When someone struggles with finding good metrics, it is often a sign that there is no clear idea about the business context. Define business goals first, only then should you start searching for KPIs.

  • Peter: “We need some KPIs for the HR department.”
  • Alex: “OK, what are the goals of HR in your company?”
  • Peter: “Well, we just need some KPIs to be able to track the HR performance!”
  • Alex: “Yes, that’s where KPIs can help, but what are the goals? Does everything work smoothly, or do you want to change something?”
  • Peter: “In the most areas we are doing good, but we want to confirm it by some numbers and benchmarks; and I guess our main goal is to improve the training process in the company”
  • Alex: “OK, so you want to track some performance metrics; and you need to find some indicators to track the improvement in the training process…”
  • Peter: “Sounds good! How can we start?”

Another typical scenario is the case when a client asks for some “out of the box” KPI scorecard. I shared my opinion about such scorecards in the Q&A section.

Before moving ahead with the rest of the steps it makes sense to review this diagram below. It helps to sort out the role of KPIs and how they relate to the other parts of the business context.

Business Context for KPIs. From vision and business goals to KPIs and action plans.

Step 2. Find “inputs” and “outputs”

Find the “inputs” and “outputs” related to the business goal or process. Let’s continue with the dialog to illustrate this idea.

  • Alex: “You want to improve the training process… How do you plan to do this?”
  • Peter: “We hoped KPIs would tell us…”
  • Alex: “KPIs don’t work in this way; they will not give you straight answers, but will help you to measure the results of your educated experiments.”
  • Peter: “OK, then what we want to try is to prepare more training materials and get more employees trained.”
  • Alex: “Fair enough. Would be an input and an output of these goals?”
  • Peter: “The input might be “the number of training hours,” and the output might be the “actual training hours,” or the “% of employees” covered!”

Step 3. Divide the “activity” and the “results”

A famous quote by Ted Levitt:

  • People don’t buy a quarter-inch drill bit; they buy a quarter-inch hole.

What about KPIs? In many cases people measure the activity, but not the result:

  • Alex: “I see, achieving certain coverage is important, but what do you really see as an ultimate goal of that training? How does it help your organization?”
  • Peter: “Trained employees are more skillful. They are supposed to do better job within a shorter period of time…”
  • Alex: “Sounds reasonable. Shouldn’t we then skip the activity measures and move directly to the result-oriented ones?”
  • Peter: “Yes, this makes sense. We can then measure improvement achieved in the performance of employees. We can use some after-training tests for this!”

Step 4. Find success factors

What we have been doing for now is trying to analyze past results and see if what we did actually worked or not. Why don’t we take control over the situation?! Try finding metrics that will help you to predict the success of the process.

  • Alex: “What would you do if after the training you don’t see the expected results?”
  • Peter: “Hm… probably something went wrong during the training. We would review the whole training process and try to analyze what was wrong…”
  • Alex: “What would you be looking at?”
  • Peter: “How the employees were engaged, how well the course is explained, if and how the course is relevant to our business challenges…”
  • Alex: “Sometimes we cannot wait for the actual results to analyze the reasons for the problem. Why don’t we do it pro-actively?!”
  • Peter: “Great idea! During the course we can measure the engagement of the students; and before the course we can analyze the relevance of the suggested training program and the experience of the trainer.”

Step 5. Make things measurable by design

Measuring “student engagement” or “relevance of the suggested training program…” It can be easier said than done. The secret here is not trying to measure something afterwards, but to make things measurable “by design,” before the process was started.

  • Peter: “To measure student’s engagement we can use some surveys afterwards…”
  • Alex: “This is one option; another option is to implement some metrics into the training process itself. I’m sure you can come up with many ideas. Some of them were discussed in the previous articles.”
  • Peter: “Yes, we can track how actively participants of the training are interacting with the IT system used for the training.”
  • Alex: “That’s a good starting point. You won’t be able to force people to be more engaged, but at least you will see early warning signals.”
  • Peter: “What about “training program relevance?” How do we measure this?”
  • Alex: “The easiest approach is to ask the trainer to share key take-aways of the training with you, or probably even the training KPIs!”

Step 6. Do controlled experiments

For some questions you won’t find answers. We are getting to the area of the “unknown” (see the “Complex” area on Cynefin Framework) where one needs to do controlled experiments before making any assumption and trying to measure things.

  • Peter: “For many performance related questions we don’t have answers yet… For example, we have no clues about what will increase a team’s engagement during the training. What should we do?”
  • Alex: “Controlled experiments! You will formulate some educated hypothesis and then will try to confirm it.”
  • Peter: “For example, one of our ideas is to try smaller groups, can this be a hypothesis?”
  • Alex: “Excellent idea! The engagement indicator that we talked about will help you to confirm this hypothesis.”

Step 7. Find bottlenecks

In many cases it simply doesn’t make sense measuring all the relevant metrics, because 90% of them will always be in the green zone. Instead, focus on the metrics related to the performance bottlenecks.

  • Peter: “It is now clear enough how to deal with goal-related KPIs. What about other indicators for HR? Do we need to track them?”
  • Alex: “It makes sense tracking them until the measurement process doesn’t consume too much time.”
  • Peter: “How can we focus our efforts then?”
  • Alex: “One technique is to find “bottlenecks.” Those might be process bottlenecks or critical business goals.”
  • Peter: “For example, in the case of HR, we can ask questions like “What stops us from finding and hiring best performers?”
  • Alex: “Exactly! This can be later formulated as an excellent performance-oriented goal.”

Step 8. Among all goals choose strategic ones

A goal to monitor some routine process can hardly be called “strategic.” We’ve discussed why the difference between strategic and operational is important. Make sure you really have strategic goals, and there are indicators aligned with them. If you have a KPI, and the only action plan is “keep an eye on it,” then most likely you could spend your resources on something better.

  • Peter: “Is “Turnover, %” applied to HR a good KPI? Or better ask, how can you make it be a good one.”
  • Alex: “It is hard to say without seeing the context, but from the first look “HR Turnover” falls into the category “keep an eye on this indicator and do something when it is in the red zone.”
  • Peter: “So, it is an operational indicator. In this case a “strategic” indicator is one that is aligned with some strategic/change goal?”
  • Alex: “Exactly! For example, the problem might be identified as a high turnover rate of the top performers, in this case the Turnover rate indicator is aligned with strategic goal, which is to “Improve conditions to attract and keep top performance,” makes perfect sense.

A few more questions related to the topic of the goals were discussed in the Q&A section.

Step 9. Do formal description of a KPI

Once you know what, why, and how you want to measure, it is time to put down all the information so that it will be easy to share with others.

  • Peter: “What technical parameters should a KPI have?”
  • Alex: “Its name of course, and a meaningful description. People need to have an agreement about what stands behind the KPI.”
  • Peter: “What about measurement units and if the value of indicator should be increased or decreased, what about calculating the performance of a single KPI, and the whole scorecard? I assume we will need all these details as well.”
  • Alex: “Yes, these details are a must.”
  • Peter: “How can we automate?”
  • Alex: “On a certain stage one can do everything with MS Excel, but sooner or later a professional scorecard software is a must. “

There is a more detailed answer to the “automation” question in the Q&A section.

Step 10. Visualize KPIs on a dashboard and strategy map

From the very beginning we were talking about business context, strategic goals, and how KPIs should be aligned with them. Needless to say, you need to be able to tell the story about where your business is at and where it wants to go. A performance dashboard, or a strategy map with cause-and-effect connections might be a great way to do this.

  • Peter: “I can now see the “big picture” of what needs to be achieved. Our team needs to take into account many factors, and focus not only on the indicators, but on the business context. What should we use – dashboards or strategy maps?”
  • Alex: “Yes, the best way to do this is to use such tools as dashboards and a strategy map. On a dashboard one can visualize many relevant charts and diagrams, while the strategy map is a great way to show the cause-and-effect connection between business goals, and aligned KPIs.”

In the Examples section one can find some free examples of strategy maps and KPI scorecards.

KPI System Template

Free Download of a 10-Step KPI System Template

Join KPI training and certification by BSC DesignerCovert separate pieces of information about Key Performance Indicators into new skills and actionable knowledge. Join "KPIs Training and Certification" by BSC Designer to learn our time-proven KPI system and get a lifetime access to the KPI training knowledge base.

More about KPI Training

Surveys and Assessments with BSC Designer Online

$
0
0

Data series in BSC Designer makes it easy to aggregate the opinions of several experts about indicators and their value. Learn how to:

  • Create data series and add several indicators in it
  • Adjust grouping value for the indicators (e.g. average or sum of experts’ value)
  • Track how indicators’ values change in time

Learn more about data series in BSC Designer Online.

Alerts and Notifications in BSC Designer Online

$
0
0

With Alerts function in BSC Designer Online one can automatically send important notifications about KPI and Business Goals to all involved stakeholders. Watch the training video and learn how to setup notifications about:

  • Value changes
  • Initiatives added
  • KPIs update interval

Learn more about Alerts function in the online manual.

Performance Reports in BSC Designer Online

$
0
0

In this training video we discuss how one can create performance reports in BSC Designer Online. You will learn how to:

  • Do a quick export of Strategy map or Dashboard
  • Create performance reports in MS Excel format
  • Export data for the KPIs into MS Excel spreadsheet
  • Create HTML report with detailed performance information
  • Calculate the cost of the strategy with Budget and Duration report

Learn more about Reports in the online manual.


Setup KPI Scorecard with BSC Designer Online

$
0
0


Metrics or Key Performance Indicators are the main part of any measurement system. From this video you will learn how to setup KPIs in BSC Designer Online. We will talk about:

  • Basic setup: name, description, update interval, measure units
  • Measurement scale setup: optimization function; the difference between performance and progress; stop-lights; using raw indicators
  • Value inheritance and grouping
  • Using containers for the indicators
  • Aligning initiatives with the indicators
  • Manual data entry, data entry via formulas, SQL indicators, and other.

Learn more about KPIs in the product manual online.

Scorecard Cascading with BSC Designer Online

$
0
0


Scorecards in your organization should not be isolated, on the contrary, it is a good idea to align one scorecard with another. This will help to explain your team the business context, and will give required numbers for the decisions. Watch this video to learn:

  • How to cascade scorecards by business goals and how to visualize the link on the strategy map
  • How to cascade scorecards by indicators

Learn more about cascading in BSC Designer Online in the product manual.

Organize Scorecard with BSC Designer Online

$
0
0

Learn how to prepare your performance measurement system for growth by organizing your scorecards with BSC Designer. Watch this video and learn how to:

  • Build an organizational structure in BSC Designer Online
  • Create new scorecards or uploading existing ones
  • Change properties of the groups and projects
  • Change the way the performance is displayed for the scorecards

Learn more about working with organizational structure in the online manual.

An Example of University Scorecard with Specific KPIs

$
0
0

Learn about the best practices for building university scorecards and measuring various aspect of the performance with Key Performance Indicators (KPIs).

In this article, we will discuss the subject and the purpose of measurement, and stakeholders’ involvement. We will analyze the indicators that are used by the ranking organization and the metrics that are popular on the dashboards of universities. In the end of the article we give away some templates and examples of the KPIs that one can use to start building a scorecard for their educational organization.

An example of the main processes in a university
University strategy map example
Examples of the KPIs for university
View University Scorecard online

A basic model of a university. How does a university work?

All educational organizations are different: they have their unique values and specific approach to teaching. But at the same time, we can find some common features in any university. For the sake of further discussion, let’s start with building a visual model of the main processes in a university. According to our experience, this step helps to make the discussion about KPIs and strategy more efficient.. If represented visually, the model looks like this:

An example of the main processes in a university

View University Scorecard online

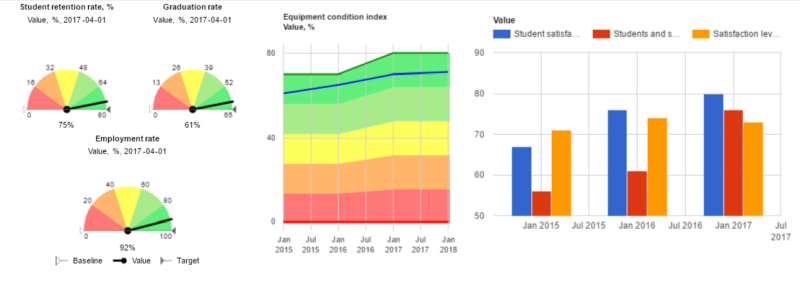
As you can see, the map also includes some performance indicators. These are the few “standard” KPIs that appear on the most university scorecards:

  • Participation rate, %. The percent of representation of certain group of the population among students.
  • Retention rate, %. Students retained in study as measured from course to course.
  • Graduation rate, %. The percentage of the students who successfully completed their qualification.
  • Employment outcomes. See “Ranking Indicators” section for specific details.

Here and below, to illustrate some of the ideas I will use the screenshots from the University Scorecard created with BSC Designer. This scorecard will be available for public access (see the links in the end of the article). You will find this process map on the “Strategy map” tab (be sure to switch between maps to access the right process map).

The persons and the systems involved. Stakeholders.

Whose interests should we take into account when a defining strategy and performance measurement system for a university?

The main “client” is a student. A typical approach is to divide students into 3 groups:

  • Prospective students and their families
  • Current students, and
  • Alumnus

Other stakeholders:

  • Academic staff
  • Professional staff (includes IT services, HR, library, etc.)
  • Regulators and various state authorities
  • Future employers
  • Community members, partners, etc.

The context of measurement. What’s the purpose of measurement?

Before starting a performance measurement journey ask yourself these two questions:

  • Why do we need a scorecard or the KPIs?
  • What challenges do they help us (and our stakeholders) solve?

To answer these questions we can revise the list of stakeholders once more. By definition each stakeholder will have some interest in the subject of measurement. Just to name a few:

  • Prospective students and their families, face a challenge of choosing the university. They need to have some benchmarks, some common ground for the comparison of the universities.
  • Ultimate goal of the students is to be prepared for future. For example, they want to understand how their courses are aligned with what is required by the future employer, and what are their chances to get good employment after graduation.
  • Professional staff need to compare themselves month to month and improve; they also need to justify a spending budget.
  • A proper evaluation system will help academic staff to improve, and will help management to decide about any reward.

Start with indicators from the international and domestic ranking systems

Now we have the context for the measurement being defined, and the candidates for the KPIs are much easier to find.

Using ranking indicators as a common ground

The next step that I would recommend is to review measurement standards that already exist in your region. They are normally represented by various international and domestic ranking organizations:

College Scorecard by U.S. Department of Education allows one to find schools using such metrics as:

  • Average annual cost,
  • Graduation rate,
  • Salary after attending

QS Top Universities also provides some good metrics to look at:

  • Academic reputation
  • Employer reputation
  • Citations per faculty
  • International student ratio
  • Employability ranking

In some cases, the metrics, benchmarks, and respective measurement methodology are available publicly. For example QS shares the details about their methods for general ranking, as well as for the employability ranking.

Many universities use the position in such rankings as one of the performance indicators on their dashboards.

Two more recognized rankings are:

  • THE (THE World University Rankings), and
  • ARWU (Academic Ranking of World Universities)

At ARWU website one can find references to other global and national ratings.

The problem with indicators used for ranking

On the one hand the rating metrics do their job. They serve as a common ground for the benchmarking; they help prospective students to shortlist universities, and help funding organizations to support their decision.

On the other hand, a university is not a production line. Standard metrics won’t take into account many intangible values. The metrics from the rankings are too general and as a result are not that useful for month to month self-improvement process.

  • For example, a popular citation index is not well accepted in some countries[1], and it makes perfect sense, as excellence in research and education should not be counted just by the number of the publications.
  • Another example is employability, while it is one of the key metrics in English-speaking countries, but in other countries it is not so popular. For example, in Russia [2] employability indicators are not explicitly used on the dashboards of the top universities.

On that point management needs to decide on a tailor-made performance management system that would track key parts of a university’s strategy execution.

Common practices. What KPIs do other universities use?

Below you will find references to the studies of the performance indicators in the education sector. On the one hand, these studies give us an idea about what metrics are being used, on the other hand, they confirm that there is no common performance measurement framework for the universities.

Indicators shared by most of the universities

J.C. Burke and H.P. Minassians in their study [3] reviewed public performance reports of the universities and found 158 distinct performance indicators. Among those indicators they have found 8 indicators that were shared by more than 50% of reviewed organizations, those 8 were:

  • Graduation,
  • Enrollment,
  • Sponsored research,
  • Student transfers,
  • Tuition,
  • Financial aid,
  • Degrees awarded,
  • Licensure test scores

Areas that are measured by most of the universities

Another research was done by Dawn Terkla [4]. She analyzed the dashboards of 66 colleges and universities and categorized her findings.

The most popular (found on more than 50% of the dashboards) areas of measurement were:

  • Endowment & Expenses Data, Advancement, Financial Aid Figures
  • Admissions Scores
  • Enrollment Figures, Enrollment Figures (Special Populations)
  • Faculty-General (such as Faculty FTE, % of faculty with terminal degree)
  • Graduation Rates, Retention rates,
  • Student Engagement
  • Student/Faculty Contact

Finding indicators for university scorecard

What indicators should universities use then? The best idea is to design tailor-made KPIs. To support this creative process we have a 12-step system for challenging KPIs that anyone can use. The example below demonstrates an approach that one can use to build a scorecard for a university.

Prepare perspectives for the indicators

Having a long list of metrics is not enough for efficient and effective performance management. It is important to:

  • Align those metrics with specific goals and initiatives, and
  • Show how those goals form a coherent strategy.

For this purpose many for-profit organizations use the 4 perspectives suggested by the Balanced Scorecard approach. In the case of the educational organizations, there is no such agreement. Universities are trying to capture their unique values and strategies in various ways, respectively the names of the perspectives vary.

For example, University of Greenwich in their Strategic Plan document [5] grouped their KPIs into the 4 perspectives that will make a lot of sense for most universities:

  • Education (outstanding learning and teaching)
  • Research (being world-class research and knowledge exchange center)
  • Community (supported by various programs for the students)
  • Services (excellence in services and infrastructure)

Another popular option is to use perspectives derived from MBQA (Malcolm Baldrige Quality Awards) model as applied to education [6]. These perspectives can be formulated as:

  • Strategic
  • Budget
  • Career
  • Information services

Below you will find my suggestions for the perspectives. If you are familiar with the Balanced Scorecard approach you will find that their names are different (changed according to the needs of the educational domain), but the cause-and-effect logic can still be tracked:

  • Stakeholder interests
  • Learning and teaching (goals related to the students and academic staff)
  • Internal services (goals related to the supporting services like IT, HR, Library, etc.)
  • Building community (goals related to building relationship with alumni and community goals in general)

Whatever approach you prefer, be sure that your perspectives are not just simple containers for the indicators, but they help to describe the cause-and-effect logic of your strategy (see Known challenges section for more details).

Building Strategy Map with KPIs for a university

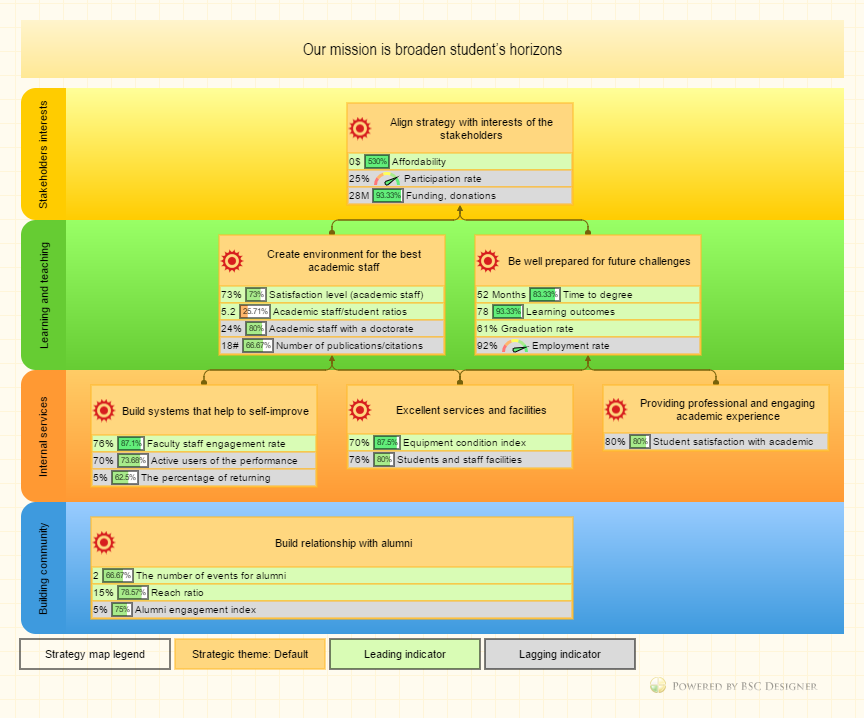
Universities have to balance their strategies between the requirements implied by the funding, academic, and community needs. Below you will find an example of a strategy map for a university that you can use as a starting point for building your own strategy map.

An example of strategy map for a university

View University Scorecard online

Mission: broaden student’s horizons

Stakeholders interests

  • Goal: Align strategy with interests of the stakeholders
    • Leading indicator: Affordability (tuition and other fees compared with average family income)
    • Lagging indicator: Participation rate, % (the percent of representation of certain group of population among students)
    • Lagging indicator: Financial aid, funding, donations, etc.

Additional metrics that might fit in this perspective:

  • Percent of revenue from different sources, %
  • Research income per academic FTE
  • Staff cost as % of total cost
  • Dollars allocated per FTE enrollment

Learning and teaching

  • Goal: [Academic Staff] Create environment for the best academic staff
    • Leading: Satisfaction level, %
    • Leading: Academic staff/student ratios (data for benchmarking can be found THE)
    • Lagging: Academic staff with a doctorate, %
    • Lagging: Number of publications/citations per academic FTE (number of publications/citations according to Web of Science and Scopus)
  • Goal: [Students] Be well prepared for future challenges
    • Leading: Time to degree (some data by National Center for Education Statistics for benchmarking)
    • Leading: Learning outcomes
    • Leading: Graduation rate, % (the percent of the students who successfully completed their qualification)
    • Lagging: Graduate employment rate (or more pragmatic “Salary after attending”)

Examples of the Key Performance Indicators for university in BSC Designer format

View University Scorecard online

Additional indicators:

  • Number of academic FTE
  • Completion rate per degree (Bachelor, PhD)
  • Student retention rate, % (measured from course to course)
  • Percent of foreigners among faculty members
  • Percent of foreign students
  • Research student number

Internal services

  • Excellent services and facilities;
    • Leading: Equipment condition index
    • Lagging: Students and staff facilities satisfaction rate
    • Lagging: International students / Total students
  • Build systems that help to self-improve;
    • Leading indicator: Faculty staff engagement rate
    • Lagging indicator: Active users of the performance measurement systems
    • Lagging indicator: The percentage of returning problems
  • Providing professional and engaging academic experience;
    • Lagging indicator: Student satisfaction with academic support

Building community

  • Relationship with alumni. Build relationship with alumni to help new generations of students with their challenges.
    • Lagging indicator: Alumni engagement index (alumnus participated in events / alumnus reached)
    • Leading indicator: The number of events for alumni
    • Leading indicator: Reach ratio, % (alumnus reached via any contact mean vs. total number of living alumnus)

All of the indicators can be further developed. For example, more details can be added to the alumni indicators, for example profiling alumnus into those who replied to the message sent, who sign-up for events, who actually participated in the events, who signed-up for volunteering, and actually volunteered (speaking on events, mentoring students, etc.), who became a sponsor, etc. It makes sense to look separately at domestic and international alumnus

Known challenges

Using perspectives as simple containers for the indicators

A typical case for many scorecards is when the perspectives work just as containers for the metrics. University scorecards are not an exception: the perspectives are often used to group the performance metrics into different silos, but not to explain the cause-and-effect logic.

In many cases the cause-and-effect is implied on the earlier stages of the strategy definition, but is not properly reflected on the scorecard. To avoid this, visualize the cause-and-effect logic directly onto the strategy map.

Focusing on what is easy to measure, but missing what is important

On a typical dashboard of a university there are various versions of easy to measure metrics such as “student retention” and “graduation rates,” but only a few features hard to measure “employability” indicators.

When choosing new indicators one needs to think about the cost and the value of the measurement. While the cost of measuring employability is high, the value for the prospective students and other stakeholders is also significant.

Below we discuss how one can do better in such cases.

Surveys give us indicators that are lagging in their nature

Have a look at the indicators on your scorecard: detect indicators that are based on students or faculty staff surveys. These indicators have some potential problems:

  • By doing surveys you are interacting with the subject of measurement and have an influence on the observed process (Heisenberg’s uncertainty principle).
  • Similar to a previous one: the survey questions are subject to different interpretation, so the results can be ambiguous.
  • The lagging nature of the surveys make it hard to use this data for month to month improvement.

Direction observation is an alternative

An alternative way to learn about the performance would be to use observation (see the Step 6 of 12 step system for challenging KPIs[7]).

Let’s take library service as an example. In additional to the annual surveys, one can use data that is already there in IT systems and track the actual use of library services and its usability for the students (in real-time). The metrics in this case will be similar to what  webmasters track to improve their presence in Google.

An example of university performance dashboard

View University Scorecard online

An example of how various approaches can be combined

A good example of balanced set of KPIs for a library is Warwick Library’s Strategic Framework. They have some survey based indicators like:

  • Satisfaction rates of final year students
  • Satisfaction rates of postgraduate researchers

And they also have some usage-based metrics:

  • Website pageviews
  • Number of files retrieved
  • Reading lists availability

Inducing wrong behaviour by stressing focus on certain indicators

We use indicators to improve, not to make things worse, but sometimes instead of helping to achieve desired results, indicators induce some unexpected behaviour.

Here is an example:

  • Regulating authorities start pushing a university towards improving retention and graduation indicators with the idea that mentioned indicators will be improved by improving the quality of education and services.
  • Universities in their turn responded by establishing higher admission standards.

The graduation rates improved, but the reason of the change is not the improvement in the quality of education.

Before, we have discussed a similar situation of indicators misuse in a business environment, I believe some findings from that article will work for the university scorecards as well.

Aligning strategies of different levels of the organization

The scorecard created for the management of the university will make less sense for other levers of the organizational structure. For example, universities’ libraries should have their own scorecard and respective performance indicators.

It is important to have a clear idea about how different scorecards support each other. You can learn more about the ways to do this in the “Cascading/Alignment” article.

Do software automation in early stages

In terms of software automation in the educational domain we see a positive trend. Many universities started using professional software for the purpose of building strategy maps and tracking KPIs. Among our users, we see more universities from Asia, Latin America and the Middle East.

If you are an education professional, then we invite you to try BSC Designer software (both its Online and Desktop versions) for free during a 30-day trial period.

To make your start easier, we suggest for you to use the University Scorecard template (with strategy map and KPIs) that was discussed in this article and that is publicly available (see the links in the end of the article).
BSC Designer team is interested in learning your story, feel free to share your findings in the comments.

Use University Scorecard project discussed in this article as a starting template for your own scorecard! Access this example project online or download .BSC project file for BSC Designer PRO.

View University Scorecard online

References

  1. ^ Anderson, A. (1991). No citation analyses please, we’re British. Science, 252(5006), 639.
  2. ^ E.V. Luneva, Key Performance Indicators (KPI) System in Education, Asian Social Science; Vol. 11, No. 8; 2015, Canadian Center of Science and Education
  3. ^ J.C. Burke, H. P. Minassians, The new accountability: From regulation to results. New Directions for Institutional Research, 2002
  4. ^ D. Terkla, The most common performance indicators for institutions and their boards, Trusteeship Magazine, January/February, 2011
  5. ^ University of Greenwich, Strategic Plan 2012–17: Summary
  6. ^ M. Arif, (2007) “Baldrige theory into practice: a generic model”, International Journal of Educational Management, Vol. 21 Iss: 2, pp.114 – 125
  7. ^ A. Savkin, 12 Steps System for the Most Challenging Metrics and KPIs, 2016, bscdesigner.com

Learn Strategy Execution Directly from Jeroen De Flander

$
0
0

Join Strategy Execution Master Class in BrusselsThe must-visit event for strategists, senior executives, and project leaders: 2-Day Strategy Execution Master Class in Brussels by Jeroen De Flander, internationally recognized expert in the field of strategy execution:

  • Strategy Execution Master Class in Europe – June 12th-13th, 2017 Brussels

We decided that those users of BSC Designer who will attend this event will need some software tool to be able to practice what they will learn on the Master Class.

Special offer from BSC Designer

Here is an offer for those who will attend:

  1. Mention “BSC Designer” when registering for the event, and we will give you for free BSC Designer PRO/Online subscription for 1 year ($479 – $360 value); If you participate in the Master Class with other members of your team, each of them will have a 1 year subscription for BSC Designer PRO/Online.
  2. Meet up with our expert for an informal chat about how to create Strategy Maps, Balanced Scorecard, and find good KPIs.
  3. Last but not least: we have agreed with organizers of the event that all of the participants who will mention “BSC Designer” will have an additional discount – don’t forget to claim it!

Be sure to register before April 21st, 2017 to catch the early bird price! To register use email mentioned at the bottom of the official brochure.

Viewing all 184 articles
Browse latest View live


Latest Images