Quantcast
Channel: Balanced Scorecard Software – BSC Designer
Viewing all 184 articles
Browse latest View live

Master Class on Successful Strategy Execution Supported by the Balanced Scorecard

$
0
0

Event: Master Class on Successful Strategy Execution Supported by the Balanced Scorecard

When: July 23, 2012 at 8:30 AM – July 26, 2012 at 5:00 PM

Where: Holiday Inn Sandton, Johannesburg, South Africa

Who should attend: Balanced Scorecard Directors, Managers and Co-ordinators, Executive Directors, Managing Directors, Vice Presidents, Chief Executive Officers, General Managers, Quality Managers, Financial Directors and Managers, HR Directors and Managers, Operations Managers, Corporate Planners, Marketing Managers, Strategic Managers, Strategic Planners, Performance Analysts

Price: n/a

More info here


ITIL V3 Expert :: MALC Training camp; certification

$
0
0

Event: ITIL V3 Expert :: MALC Training & certification

When: July 31, 2012 at 9:00 AM – August 4, 2012 at 6:00 PM

Where: Hotel Visaya, Panchsheel park, New Delhi – 110017

Who should attend: Balanced Scorecard Directors, Managers and Co-ordinators, Executive Directors, Managing Directors, Vice Presidents, Chief Executive Officers, General Managers, Quality Managers, Financial Directors and Managers, HR Directors and Managers, Operations Managers, Corporate Planners, Marketing Managers, Strategic Managers, Strategic Planners, Performance Analysts

Price: n/a

More info here

Lean Six Sigma Black Belt Certification Training

$
0
0

Event: Lean Six Sigma Black Belt Certification Training

When: September 8, 2012 at 9:00 AM – September 16, 2012 at 5:30 PM

Where: Hotel Park View, Mumbai

Who should attend: Balanced Scorecard Directors, Managers and Co-ordinators, Executive Directors, Managing Directors, Vice Presidents, Chief Executive Officers, General Managers, Quality Managers, Financial Directors and Managers, HR Directors and Managers, Operations Managers, Corporate Planners, Marketing Managers, Strategic Managers, Strategic Planners, Performance Analysts

Price: n/a

More info here

Certified Balanced Scorecard Masterclass

$
0
0

Event: Certified Balanced Scorecard Masterclass

When: September 18, 2012 at 9:30 AM – 5:00 PM

Where: London, UK

Who should attend: Balanced Scorecard Directors, Managers and Co-ordinators, Executive Directors, Managing Directors, Vice Presidents, Chief Executive Officers, General Managers, Quality Managers, Financial Directors and Managers, HR Directors and Managers, Operations Managers, Corporate Planners, Marketing Managers, Strategic Managers, Strategic Planners, Performance Analysts

Price: n/a

More info here

Strategic Thinking and Planning

$
0
0

Event: Strategic Thinking and Planning

When: September 16, 2012 at 8:00 AM – September 20, 2012 at 3:00 PM

Where: Dubai

Who should attend: Balanced Scorecard Directors, Managers and Co-ordinators, Executive Directors, Managing Directors, Vice Presidents, Chief Executive Officers, General Managers, Quality Managers, Financial Directors and Managers, HR Directors and Managers, Operations Managers, Corporate Planners, Marketing Managers, Strategic Managers, Strategic Planners, Performance Analysts

Price: n/a

More info here

Forrester’s IT Balanced Scorecard Workshop

$
0
0

Event: Forrester’s IT Balanced Scorecard Workshop

When: September 20, 2012 at 8:30 AM – 4:30 PM

Where: Forrester Research – San Francisco

Who should attend: Balanced Scorecard Directors, Managers and Co-ordinators, Executive Directors, Managing Directors, Vice Presidents, Chief Executive Officers, General Managers, Quality Managers, Financial Directors and Managers, HR Directors and Managers, Operations Managers, Corporate Planners, Marketing Managers, Strategic Managers, Strategic Planners, Performance Analysts

Price: n/a

More info here

Webinar – Integrating Risk Into Your Balanced Scorecard

$
0
0

Event: Webinar – Integrating Risk Into Your Balanced Scorecard

When: September 27, 2012 at 4:00 PM – 5:00 PM

Where: This is a web based event

Who should attend: Balanced Scorecard Directors, Managers and Co-ordinators, Executive Directors, Managing Directors, Vice Presidents, Chief Executive Officers, General Managers, Quality Managers, Financial Directors and Managers, HR Directors and Managers, Operations Managers, Corporate Planners, Marketing Managers, Strategic Managers, Strategic Planners, Performance Analysts

Price: n/a

More info here

BSP Part 1: Introduction to the Balanced Scorecard

$
0
0

Event: BSP Part 1: Introduction to the Balanced Scorecard

When: Sept 17-19, 2012

Where: Alexandria, VA

Who should attend: Balanced Scorecard Directors, Managers and Co-ordinators, Executive Directors, Managing Directors, Vice Presidents, Chief Executive Officers, General Managers, Quality Managers, Financial Directors and Managers, HR Directors and Managers, Operations Managers, Corporate Planners, Marketing Managers, Strategic Managers, Strategic Planners, Performance Analysts

Price: n/a

More info here


Developing Meaningful Performance Measures for Business and Government

$
0
0

Event: Developing Meaningful Performance Measures for Business & Government

When: Sep 26-28, 2012

Where: Nairobi, Kenya

Who should attend: Balanced Scorecard Directors, Managers and Co-ordinators, Executive Directors, Managing Directors, Vice Presidents, Chief Executive Officers, General Managers, Quality Managers, Financial Directors and Managers, HR Directors and Managers, Operations Managers, Corporate Planners, Marketing Managers, Strategic Managers, Strategic Planners, Performance Analysts

Price: n/a

More info here

Kaplan-Norton Balanced Scorecard Certification Boot Camp

$
0
0

Event: Kaplan-Norton Balanced Scorecard Certification Boot Camp

When: 17-21 September, 2012

Where: Johannesburg

Who should attend: Balanced Scorecard Directors, Managers and Co-ordinators, Executive Directors, Managing Directors, Vice Presidents, Chief Executive Officers, General Managers, Quality Managers, Financial Directors and Managers, HR Directors and Managers, Operations Managers, Corporate Planners, Marketing Managers, Strategic Managers, Strategic Planners, Performance Analysts

Price: n/a

More info here

BSC Designer

$
0
0

BSC Designer® is a performance management software. It supports the Balanced Scorecard framework, which according to yearly studies continues to be one of the most popular tools for planning and executing a business strategy.

The heart of the Balanced Scorecard is a strategy map. BSC Designer allows you to design state-of-the-art strategy maps, representing your business objectives and the cause-and-effect relationships between them.

Strategy map is the heart of the Balanced Scorecard

For a top manager, the strategy map plays the role of a performance management and monitoring dashboard:

  • The Balanced Scorecard suggests four perspectives.
  • Each of these perspectives includes business objectives.
  • These objectives, in turn, are linked to each other with cause-and-effect relationships.
  • KPIs attached to each of these objectives measure your business performance, or your progress toward your strategic goals.
  • The stop-light of the KPI indicates your current performance and progress levels.
  • In the end, your business goals are clearly linked to detailed action plans.

Using the strategy map?

You can use the strategy map in several ways.

  • The strategy map also helps to align actions with business goals, so employees can understand their role.  They can think of their work as “helping the company to achieve its objectives,” rather than simply “doing my job.” Learn more about alignment.

Managing director shares his opinion of communicating the whole picture to employees

  • Executives use a strategy map to monitor current performance and to track their progress toward planned business objectives.  BSC Designer makes this easy with KPIs and Dashboard tabs. Learn how to do this in BSC Designer.

Dashboard in BSC Designer

A cultural shift with Balanced Scorecard Monitor performance constantly
  • The strategy map shows you the big picture of what is happening in the company, why it is happening, and what you can do about it.
  • As a result, the strategy map helps you to execute your business strategy, and engage your employees.
CFO uses BSC Designer to visualize strategy in clean understandable picture Track results in real time Keep control of vital metrics

Use Initiatives in BSC Designer to defina a detailed action plan linked to a KPI

Execute the strategy with BSC Designer Better view on business goals Translate intuition in strategic plan

Building a strategy map in BSC Designer

BSC Designer is much more than a drawing tool.  What you see on the strategy map is a representation of real data, which you can access at any time.

On the KPI tab, you can manage your Key Performance Indicators.

Manage KPIs in BSC Designer

  • You can enter KPI values manually for a specific date.
  • Import data from MS Excel, or on an SQL database.
  • Choose an optimization direction for each KPI.
  • Attach an action plan as an initiative.
  • Monitor each indicator’s current performance.
  • Track its progress toward a target value.
  • Use stop lights to see whether these values are in the expected range.
  • Receive email notifications about important changes.
Create Hierarchical KPIs Design Multi-level BSC Organize KPIs

You can also visit the Business Goals tab in BSC Designer, to access your business objectives.

Business goals in BSC Designer

BSC Designer allows you to:

  • Specify cause and effect relationships between your objectives. Learn how.
  • Attach KPIs and initiatives to each objective. Learn how.
  • Choose how each element will be displayed on your strategy map.
Map objectives Drill down objectives KPIs for perspectives

Getting business data in BSC Designer

Whether you’re monitoring your current business performance or controlling a business improvement, you need to get your business data into BSC Designer.

  • You can manually enter data about your KPIs.
  • Read data directly from a MS Excel spreadsheet.
  • Access an external database with an SQL indicator.
  • Define custom formulas, like the total or average of other KPIs.

By default, the performance function for each KPI is a simple line function, with a minimum value, maximum value, and current value.  But experienced business analytics can customize this, as well.

Import your data into the Balanced Scorecard

BSC Designer lets to import data from a database

Teamwork with BSC Designer

As your performance management and monitoring project grows, more people will get involved.  BSC Designer is ready to help.  You can easily:

  • Share your Balanced Scorecard with other users.
  • Notify users about important changes.
  • And even create complex cascading scorecards.

Reports for the Balanced Scorecard

You can give employees direct access to your Balanced Scorecard, or share selected details with them:

  • You can generate a variety of reports, including our popular HTML report.
  • Export data from your Balanced Scorecard to MS Excel, including all your formulas.
  • Or, create a MS Powerpoint presentation including the most important details from your Balanced Scorecard.

Balanced Scorecard HTML Report

Balanced Scorecard in HTML or PowerPoint report Communicate results for clients

Moving up from MS Excel

If you ask most business people where they keep their business data, you’ll probably hear, “In a MS Excel spreadsheet.”  Excel is a must-have business tool these days!

Unfortunately, Excel is not really suitable for the Balanced Scorecard.  It may be possible to design a few KPIs in Excel, or a simple strategy map, or a prototype of your Balanced Scorecard.  But to design, implement, and update a complete Balanced Scorecard, you’ll need a more powerful tool.

  • The next step is to switch to specialized software designed for the Balanced Scorecard, like BSC Designer.

Don’t worry about your data.  BSC Designer can read your existing data directly from your Excel spreadsheet.

Avoid using Excel spreadsheets for the Balanced Scorecard Balanced Scorecard is difficult to build with Excel Balanced Scorecard in Excel is hard to update

User-friendly interface for the Balanced Scorecard

We’ve invested a lot of time in designing a user-friendly graphic interface for BSC Designer, and we’re constantly looking for new ways to make it even easier.  Many of our users have called BSC designer “easy to use,” “user-friendly,” an “intuitive tool” that “helps a novice” get started.

BSC software with a powerful functionality Balanced Scorecard software that is easy to use for novices Easy to understand Balanced Scorecard software

BSC Designer Interface

Some users even say that BSC Designer helped them to understand the whole concept of the Balanced Scorecard, better than they did before:

Learn BSC method Balanced Scorecard software easy for a newbie Intuitive Balanced Scorecard tool

A word about our competitors

Why should you choose BSC Designer instead of one of our competitors?  We believe that BSC Designer provides all of the Balanced Scorecard automation and functionality you need, in a simple, user-friendly manner.  Some of our customers tell us that they decided to use BSC Designer because it was so easy to  implement: no special databases, no complicated installations, and very easy maintenance.

Visual method for BSC Easy to maintain and input data
The best BSC software in the market Balanced Scorecard software benchmarking

Get BSC Designer desktop and web-based

You can use BSC Designer on your Windows desktop, or on the web, with any browser, any device, even your smartphone or tablet.

  • BSC Designer Standard Download trial version Buy Full Version
  • BSC Designer PRO Download trial version Buy Full Version
  • BSC Designer Online Start trial period of BSC Designer Online Log in BSC Designer

There’s no special database to install.  BSC Designer saves your Balanced Scorecard projects as simple files that you can store on a local disk, or upload to access with our web-based edition.

BSC Designer is extremely easy to install Simple installation of BSC Designer

Download our free trial, and explore all of our features for a full 30 days.  You don’t need a credit card, and you don’t need to fill in any long, complex forms.

Why KPIs are just a tip of the business performance iceberg

$
0
0

KPIs don’t work without a proper business context! Right?! Then how is one supposed to get this business context? If KPIs are just a tip of the iceberg, then let’s talk about the iceberg itself! Here is a business story or a case study reworked and prepared for publishing with the  permission of the client.  

Why KPIs are just a tip of the business performance iceberg

A client from the banking industry contacted us with a request to “prepare better KPIs for SLA.” They had a Service Level Agreement (SLA) between customer service and bank card embossing units. According to the statement of the management these units were under-performing and they hoped to change the situation with better KPIs.

The review of SLA

I’ve briefly reviewed the SLA document, and it was full of the technical details, definitions of the communication methods, and the response time requirements. Sometimes the text was really formal, and it looked like the author had to put something there just because it was required by bank standards; sometimes there were some technical details about bank’s back office that did not sound familiar to me.

  • The only performance indicators implemented were time deadlines for the communication between business units.

After this short review I wanted to understand what exactly the problem was and what exactly was under-performing. Together with the client we started analyzing the situation. The client named some typical problems that both business units face regularly, such as late delivery by the embossing unit or the providing of incomplete information by customer service.

  • I’m simplifying, but the idea of the customer was that good indicators would help to monitor the proper delivery time and ensure that the two business units exchange the correct data and worked well as a result.

Where is a bottleneck?

Instead of reviewing all of the minor business processes one by one, I asked a simple question:

  • What process described in SLA limits the performance the most? E.g. where is the bottleneck of the process described in this SLA?

It was the first insight for the customer. He agreed that the bottleneck should be somewhere there, but reviewing the SLA document again and again did not help much. It was loaded with technical details, but even for a bank employee it was hard to see the big picture.

  • We agreed that it is better to map the most important steps of the SLA in some type of graphical form.

How the customer value is communicated

I continued asking questions about the under-performance and how it was  defined. This time we talked about the value that the bank provides to the customer, why customers open an account, and what the lifetime value of the customer is for the bank. The bank defined some strategic priorities via such vague statements as “to provide the best financial service,” and some were more specific ones like “provide access to banking service from anywhere, using desktop, tablet, or smart phone devices.”

I asked how these values are translated down to the customer service unit. The problem was that nobody thought about this seriously.

  • For example, many bank clients used an iPhone app to access their account. But when they needed to contact their personal manager they were redirected to the main websites that was not optimized for smart phones and customer was supposed to fill in a detailed contact form that obviously repeated information that the bank already had.

In the search of the reasons for the under-performance 

According to the top management one of the aspects of the under-performance were clients who stopped using the services of this bank actively and finally closed an account.

  • The only thing that customer service did in this case was ask a single question: “Why did  you close an account?”

There were some predefined answers like “relocation to other country” or “moving to another bank,” and it was not a surprise that most customers just answered that they opened an account in another bank, while the real reason was not revealed.

A way to improve

For me it was obvious that another set of performance indicators wouldn’t help much. I suggested top managers to:

  • Map again the current risks, challenges, and problems that the bank faced.
    • The biggest problem with customer retention was that there was no clear segmentation of the reasons why customers closed an account.
  • Update the strategy map accordingly with specific objectives.
    • On the top level of the strategy map the two general directions were: attract more clients and control customers’ retention.
    • The bank decided to implement a specific business system to professionally survey customers that are closing their accounts.
  • Use this strategy map to communicate objectives to the departments.
  • Assign specific performance indicators.

Bank Strategy Map in BSC Designer

The first results were amazing: well formulated questions asked in the right way revealed some problems that were significant for customers:

  • It appeared that getting a copy of the accidentally lost monthly statement was a real nightmare for a customer.
    • In some branches customers were told that it was  not possible, in some they were asked to pay a fixed fee, and only in some was it done for free. Bottom line: there was no standard procedure for that.
  • The biggest security concern as perceived by customers was that transactions were not confirmed via SMS.
    • An early warning signal for this were calls with questions about how to activate this service. Unfortunately, call center specialists had no other opportunity, but just to tell that there is no such  function yet.
  • The process of card recovery (in a case card details were compromised or the card was lost) involved complicated paperwork.
    • Several customers were living in other countries and they were told that they needed to do all the paperwork personally in the bank’s office, which meant  unplanned travel costs for them.

Communicating the strategy to the departments

The big picture of the value provided to the customer was much clearer now for the management. Now, it was not just a set of vague concepts, and management knew exactly what the biggest issue was for their clients. Once the real reasons of the under-performance were revealed they were able to communicate these new requirements to the lower levels.

For example:

  • In a case a card was lost or card details were compromised when a client was traveling abroad, customer service suggested the client  send his new card to the hotel with a high-priority post so that the client would have it in a maximum 2-3 days, or sooner if there was a branch of the bank nearby. This change involved high mail costs, and required some logistics updates, but the number of customers who were closing an account in this case was reduced to zero.
  • The time needed to get a copy of the monthly statement was reduced to 3 minutes on average if a customer was visiting the bank office and it was as simple as 2 clicks if a customer used online banking.

In both cases the additional services were provided for free, and the costs were compensated by a longer customer lifetime.

KPIs and simple indicators in SLA

Before, only the “total retention rate” was measured. That approach actually hide a part of the picture. In the updated version the retention rate KPI was formed by the average of retention rates based on the reason for leaving the bank:

  • Clients lost due to the relocation [weight = 2]
  • Clients lost due to the card security issues [weight = 3]
  • Clients lost due to the administrate issues [weight = 5]

Clients lost due to the relocation had a lower relevant importance (the weight), as management did not see any way to affect it.

Bank Strategy KPIs in BSC Designer

Some additional indicators were implemented into SLA between customer service and card embossing units, for example:

  • For customer service unit: time to react on a “card lost abroad” query.
  • For embossing: time to reissue and send a card processed as “card lost abroad.”

The top managers saw a single indicator “Lost card processing time,” which was formed by a sum of two child indicators.

Finally, some local indicators for process monitoring were implemented:

  • Time to reissue an account statement in the bank office.
  • Client’s time for the paperwork related to the lost card.

Needless to say, all of the indicators were aligned with specific business objectives. Those objectives were placed on a map where they were linked by  cause-and-effect connections with each other and the performance factors.

KPIs is nor the problem neither the solution

With this case study I wanted to show that the KPIs in the most cases are not the problem, and neither are they a solution. When a company searches for a KPI, it actually searches for an in-depth analysis of the current business situation. And it is important to do it before implementing any KPIs.

Here is a checklist that might help:

1. Understand the biggest business challenges.

  • What stops customers from buying?
  • Why do clients leave the company?
  • Are there any bottlenecks that limit performance?

2. Define a possible reaction regarding these challenges.

  • What can a company do to fix this?
  • What problems are outside the company’s interest?

3. Update business systems, and translate these ideas to the lower levels.

  • How can a company’s employees help to achieve these business goals?
  • What business systems do you need to implement?

4. Implement control points to make sure that everything is working properly.

  • How do we know that what we did actually helped?
  • How do we know that we are continuing to do  it in the right way?

Finally, let me repeat another commonplace idea: a performance management is a marathon, not a sprint. Be prepared to repeat this analysis frequently, and to take into account new challenges and ever-changing business conditions. Whatever the case is, it is always wise to start with initial business conditions and then move to the specific KPIs.

Download the project of BSC Designer that was discussed in this case study. To open the project you will need to download BSC Designer PRO.

Download .BSC Project

How is performance management analysis/review organized in your company? What tools do you use to describe the strategy and support its implementation?

Introduction to BSC Designer

Pair programming and strategy description

$
0
0

When do you think it is a good time to work on a strategy? In the end of the year? Every quarter? During summer holidays? I’m not talking about formal strategic review that is “strategic” only because top managers are involved; I’m talking about the process oriented on increasing customer value.

Unexpected finding 2 strategy experts

What strategy description is about

Strategy description is nothing more, but a way to formalize your business insights, doubts, and challenges. Here are some typical questions that you might ask:

  • What might be preventing your company from achieving the goals you have?
  • Who do you think is your client? Who is actually your client and how can you find it out?
  • What problems face your clients and how is customer value produced?
  • Why your clients buy your product or service? What stop your client from buying?
  • What makes your client start searching for another vendor?
  • What information do you need to understand your market better? How can you obtain this information?
  • What are bottlenecks in your business? What business system do you need to tweak?

The actual strategy is a mix of reasons, problems, and solutions. If one say that their strategy is simple, then he or she is talking about top level goal, while the existence of a detailed strategy is implied and it is hopefully described somewhere in a written form.

  • The strategy is about answering in the details to the “Why?” and “How?” questions of your business.

Strategy “bad practice”

There are various books and articles about strategy best practices, but there is one big and very dangerous “bad practice.” I’m talking about “silo thinking” when an access to the strategy document by company employees is very limited. Such strategies don’t get a buy in from employees and are hard to execute.

  • Strategy is everyone’s job, instead of hiding it under several bureaucratic layers consider sharing it with your own employees.

Strategy magic pill doesn’t exists, but…

Finally, all strategies are individual and only you with your experience can produce the best strategy for your company. How can we help? Our BSC Designer can save you hours of unnecessary technical work. BSC Designer software helps you a lot with a strategy description. Check out what our users say about this.

Any leader has it’s own style and approach to the strategy description:

  • You can have just a basic strategy map, and focus more on KPIs, or
  • The main part of your strategy might be business maps where KPIs are used for control points, or
  • You might follow Balanced Scorecard framework.

BSC Designer can help you whatever your case is.

Some case studies

To illustrate the variety of possible approaches to strategy description let me show you two case studies. One comes from Mexico and another from Germany. As you can see in these two cases, BSC Designer was used in a completely different way. I could share even more case studies, but the idea is that:

  • Strategy definition is unique; a scheme to follow is individual in each of the cases;
  • Strategy description is more formal and software automation can help.

How exactly can BSC Designer help? It depends a lot on your needs, the good starting point to research the software is to check out video manuals for various features.

What pair programming have to do with a strategy?

Finally, you might be curious about the title that we chose for this article: “Pair programming vs. strategy description.” Let me explain. Pair programming is agile software development technique that helps to improve code quality. In theory, this idea can be applied to any domain, what about strategy description and business scorecards?

We did an analysis of BSC Designer PRO licenses sold to small business clients and we noticed an interesting trend:

  • Customers who bought 2 licenses are 60% more likely to stay active with their scorecard projects after the first year (as far as we can track this by questions directed to customer support and regular updates) than those who bought just 1 license.

When we found this out, the first hypothesis was that they pay more and as a result they are more serious about their project. This sounded logically, but we decided to go ahead and interviewed some of these customers.

It appeared that they used an approach that was very similar to the pair programming, but applied to strategy and KPIs domain.

Probably this pair approach to the strategy was one the reasons why they were more successful with their business scorecards (we know that their scorecard projects survived at least after the first year).

Not all KPIs are equally important – KPI weight in BSC Designer

$
0
0

Not all indicators on your scorecard are equally important for the total performance score. A good example is a pair of “Time to answer” and “First contact resolution rate” KPIs.

Pair of support KPIs in BSC Designer

Is it more important to answer a support query fast or to answer it with some meaningful information that will actually help a client? General sense tells us that the balance is important in this case:

  • Excellent answer that a customer was waiting for 2 weeks is not a good business practice;
  • Some pointless response like “check out the manual” even if received in 30 minutes won’t make your client happy neither;

So where is the golden mean  and how can we automate the calculation of the performance taking into an account these ideas? The “weight” property of an indicator will help in this case.

Let me illustrate this idea. I created a container called “Customer Support”, and chose to calculate its performance as “weighted average.” Inside, I created two child indicators – “Time to answer” measured on a 0..48 hours scale; and “First contact resolution rate” measured on a 0..100% scale.

Customer support container for 2 indicators

Now, let’s reflect on the idea of the relevant importance and set the weight equal to 3 for the “Time to answer” indicator and the weight equal to 6 for the “First contact resolution rate” (I’ve moved columns in the KPI tree to show respective weight values). In this way we tell the program that “First contact resolution rate” is 2 times more important than “Time to answer.”

Time to answer KPI with a weight equal to 3

Let’s check out how the performance of “Customer Support” behaves in various cases:

  • For a 1 hour average answer time (equals to 97,92% performance of “Time to answer”), and a 25% first contact resolution rate (equals to 25% performance “First contact resolution rate”), the performance rate of the “Customer Support” is just 49,31%. We are giving answers fast, but we are underperforming, as these answers don’t really help to solve client’s problem.

Case 1: low first response rate, good response time

  • For a 20 hours average answer time (equals to 16,67% performance of “Time to answer”), and a 70% first contact resolution rate, the performance of “Customer Support” is 66,11%. Our answers are not the fastest ones, but they help clients to solve their problems.

Case 2: high first contact resolution rate

Learn more about managing KPIs and specifically managing indicators’ weight in the respective section of the video manual.

Everything looks fine, but there is something that we can improve. The performance function used for “First contact resolution rate” is a linear one, in other words, for the program, changing “First contact resolution rate” from 20% to 40% is the same as changing from 80% to 100%. Any experienced executive understands that it is not what we see in the real business world. The initial improvement is normally easier, while improving from 80% to 100% is more difficult and is not possible in some cases.

Linear optimization function

To reflect this idea in BSC Designer we can change the optimization function for “First contact resolution rate” from a linear to the exponential formula “Exponential growth 2.”

Exponential growth function for kpi

The performance will grow rapidly in the beginning, then it increases slowly. The performance function can be adjusted even more precisely, and you can define the specific performance function for each value interval.

Define performance function on the interval

For example, you might want to use a linear function from a 0 to 40% resolution rate, and then for 40% to 100% intervals use an exponential growth function mentioned above.

The idea of the weight of a KPI is supported by some of the other modules in BSC Designer:

  • There is a weight chart that can be selected for an indicator or it can be visualized on a dashboard. This chart visualizes relevant weights of indicators.

Weight chart in BSC Designer

  • On the “Analysis” tab there is an “Absolute weight analysis” that helps to find the most important indicators.

Absolute weight analysis for KPIs in BSC Designer

If you have not had a chance to try this function, then download the trial version of BSC Designer PRO right now.


Why A Balanced Scorecard Is Crucial To the Survival of a Growing Business

$
0
0

During my career as a HR professional, I have been exposed to a range of rapid growth start-up businesses, which has given me a rare insight into the challenges that organizations face as they move from being a small stage start-up to a small to medium sized enterprise.

Transition from operationally immature organization

In particular, there can be lots of: energy, creativity, activity, and goodwill, but this is often not channeled correctly, meaning there is a lot of wastage and a lack of focus in the right areas. The organization is operationally immature. But, there is a time in every start-up’s life when they must start making that transition to being a mature organization.

Unify the efforts of  team with Balanced Scorecard

  • In my experience, organizations start needing to make this transition from immature start-up to mature SME (Small and medium enterprises) when they hit around 50 people.

If this transition phase isn’t correctly handled, the organization can run into quite serious trouble.

Firms often lose focus as they transition from a start-up to an SME

What tends to be happening here is that you have a group of managers and staff who have been hired and groomed to work well in small, tight informal teams of people. They are geared toward working in a smaller environment. However, as the organization starts growing beyond 50 and 100 people, those skills that were suitable for operating in a company of 20 people, are less suitable for working in a company of 100 people, where there can be a greater emphasis on formal planning skills and advanced interpersonal and collaboration skills.

As a result I have often observed high employee turnover at this stage as the less adaptable, early stage start-up employees leave and are replaced by SME geared employees.

  • At this point, a lot of the knowledge and information used to operate the business leaves with those departing employees as documentation and systems tend not to be a priority.

This makes it harder for incomers as the information they need to do their jobs is often not available. All this change in my experience can lead to a loss of focus, direction and energy.

Bring back team cohesion, focus and direction with a balanced scorecard

The solution to this problem is for me simple and that is that employees need to be channeled so they are working in line with business goals. But, the problem is that small business geared senior managers are often not equipped to communicate business goals in a larger more established business. It needs a much more sophisticated system of communication and management than a quarterly town hall meeting, to engage and unify the efforts of a large work force.

Best Practice: using Balanced Scorecard

This is exactly the time that businesses should be using a balanced score card. As many of you will know a balanced score is a simple management concept where you establish high level business goals such as: growth, profitability, customer satisfaction, which need to be reached to meet the main goal.

Overview report with high level business goals


These goals are handed out to senior managers and may be divided further into sub-goals and handed out to middle managers and eventually staff, right down to the cleaner. Having this kind of balanced score card is the most effective way to motivate and channel employee performance towards meeting organizational objectives. Used properly it can create, restore and maintain, team cohesion, focus and direction in organizations going through the stormy transition between start-up and an established business.

Software such as the BSC Designer makes balanced scorecard implementation easy

Of course, back when I was first observing these growing pains, I could see that a balanced scorecard could be effective, but couldn’t see initially how time pressurized small business leaders would be able to implement what can be a complicated process. All that has changed now, as modern software applications such as the ‘Balanced Score Card Designer’ software (BSC Designer) automate much of the: analysis, preparation, reporting and presentation process, completely removing  or reducing bureaucratic, administrative or technical barriers to using a balanced scorecard in a business.

  • Using a tool like BSC Designer means you are not starting from scratch like you would be if you were doing it in Excel.

The system has inbuilt: intelligence, tutoring and a framework which you can follow to implement a balanced score card in your business.

Build in framework for Balanced Scorecard

And so if your executive team are too stretched, a smart business intern or PA could quickly set up and manage this system for your management team, if you didn’t have an executive free to do it.

Scorecard in BSC Designer

For example, to begin with the BSC Designer system by default includes the most common high level business goals which are: Financial, Customer, Internal Process and Learning and Growth. The system allows you to quickly add relevant KPIs/goals to each high level business goal. You can then add further levels of sub-goals to reflect your operational hierarchy. Of course, you can easily assign people to these goals and sub-goals, thereby aligning employees with organizational goals.

High level business goals in BSC Designer

The system then allows you to assign the parameter for each goal, e.g. what numbers represents success and failure to put it bluntly, and it will automatically calculate performance or progress against each sub-goal and goal, as long as you enter the actual value on a regular basis. You can assign update intervals for each goal which means the system can also facilitate the updating process.

The BCS Designer system makes it easy for you to track overall performance against business objectives and to identify which specific areas of the business are failing to deliver effectively against performance goals.

Track overall performance against business goals

A range of reports can be automatically generated on the fly, including: Strategy Maps, Digital Dashboards, and Risk Indicators Reports.

Automatically generate dashboards in BSC Designer

The BCS Designer is an example of a modern enabling tool that will make it much easier for you to manage your balanced scorecard implementation, and align your organization to your company’s goals, which is a crucial management challenge which companies must overcome as they move from a start-up to an established small to medium sized enterprise.

BSC Designer Training and Certification

$
0
0

While BSC Designer is recognized by more business professionals all over the world, we see an increasing demand for specialists familiar with our product that can help local companies to set up KPIs, strategy maps, and scorecards.

We are opening an online training + certification course for BSC Designer software. It consists of several lessons, home tasks, and for sure a feedback from our side.

Get trained and certified in BSC Designer

As a result, you will have a BSC Designer Specialist certificate. This certification is not only a great way to demonstrate your proficiency in business performance management software in your CV, but is also an excellent opportunity to join our partners network. In our partners network we connect together specialists that are certified in BSC Designer and the customer companies that are interested in a  local representative.

Get a Specialist Certificate

Join the training and certification program by filling in the online form:

[contact-form-7]

Effective KPIs: 6 common problems in target setting

$
0
0

One of the most difficult tasks for any manager is measuring an employee’s current skill and potential in a manner that helps them achieve a desired performance-based outcome, while still supporting the goals of an organization.

This desire to push employees to achieve performance targets is more prevalent than ever due to the fast-paced, high-powered nature of our technologically advanced world. And that’s why good performance management is a key factor in helping a small business grow into a big business, and why it helps all businesses maintain structural integrity and efficiency.

6 problems in target setting

Performance management is based heavily in KPIs

For those that don’t know, performance management is an evaluation process that allows managers to look at data that (should) tell them how well an employee is performing, and whether or not they’re actively advancing the organization’s purpose, or simply just playing the part. These processes, which are based heavily in key performance indicators (KPI), can offer metrics that help an organization achieve objectives, but only if those objectives are clearly defined.

Clear objectives help tracking positive change

You see, therein lies the problem for most managers. Without setting clearly defined objectives, they’re unable to track or measure positive change either with the employee, or with the company’s goals.

Let’s first take a look at six common problems in target setting:

  1. Many managers set goals that are based on the wrong performance measures, meaning they’re not accurately describing the main objective. It’s like saying your target is a dartboard, instead of the bulls-eye.
  2. Goals are based on past performance, instead of future standards. By doing the latter, you’re ensuring that you set expectations instead of taking what’s been given in the past and trying to barely exceed those goals.
  3. Managers often put unrealistic expectations on employees, which leads to poor performance or an unmotivated workforce. These expectations can be too high or too low, so finding the sweet spot for each individual is important.
  4. Placing all expectations on financial goals is often a problem in target setting. More times than not, things that lead to financial goals, such as customer relations or service, end up having a more positive impact when they’re addressed correctly.
  5. Using ineffective data analysis programs that don’t help you track your employees’ goals is often a major mistake. Knowing what to look for is one thing, knowing how to measure it is another entirely.
  6. Agreement on action plans between managers and employees is important. Just because the manager understands the expectations and goals clearly, doesn’t mean the employee has the same vision.  Defining roles, placing markers along the way, and having open lines of communication as the process commences is imperative to success.

It goes without saying that without clearly defined KPIs you’re setting your employees and company up for failure. That’s why managers should understand that goals that align with a company’s overall strategy benefit everyone equally. And remember that the only way to reach these goals, other than what’s been mentioned, is to continually measure and analyze the results. This critical link ensures that what they’re doing on a daily basis matches the needs of the company, and that the company is receiving the best from their employees day-in and day-out.

An employee’s expectations mirror the strategic goals of a business

Here’s an example of how an employee’s expectations can mirror the strategic goals of a business:

Long-Term Vision (Business)

  • To increase direct sales through demonstrator support

Goals and KPIs

Current Objective (Business)

  • Put more demonstrators in front of potential customers through hosted parties and workshops

Key Performance Indicator (Business)

  • Measure amount of new parties hosted parallel to past analytics (volume and sales)

Demonstrator Goals (Employee)

  1. Hold two extra parties per 30 day period.
  2. Increase sales by 10 percent per party hosted.

Key Performance Indicator (Employee)

  • Performance will be measured at the end of every month by immediate supervisor. Results will determine what can be done to improve, what’s working, and what can be done to improve areas for other employees.

To help you better define effective KPIs, you must first understand the objectives of your company, the abilities of your employees, and the ways in which you can make a strategy into a reality. That’s why you must first be able to answer what the overall vision for the future should look like, and how it can be accomplished. Furthermore, you have to remain flexible to the fact that objectives can and do change, so you don’t want to remain too static when it comes to developing a strategic direction.

Above all, you should remember that measuring these results is critical to long-term success.

  • Just because something is currently working, doesn’t mean it’ll will continue to work in the future.

Being able to help your employees adapt to changes in the business climate will not only help you build trust within your workforce, it’ll ensure that they’re keeping up with the evolving strategy.

KPIs in BSC Designer

Let’s delve into KPIs once again to determine what is you need to measure as you continue. First and foremost, using a proper performance management tool, one like BSC Designer, is essential to 1) make your job easier and 2) make your plan a success. That’s because even if you already know a ton about KPIs, you might not know all the ins-and-outs.

BSC Designer actually supports the Business Scorecard framework, which is consistently one of the most popular tools for executing a business strategy. And not only is it a strategy map, BSC Designer can visualize business processes and KPIs and act as a base for strategy discussions, performance reviews, or as a presentation of your strategic ideas. In layman’s terms,  it can see the “big picture” of your strategy, and give you the tools to measure your plans success.

Strategy map with KPIs and business objectives

BSC Designer can indicate which metrics adhere to your vision and strategy, and which are inconsequential to your success. It can measure and give benchmarks along your goal’s path. It can even help you determine which metrics could be manipulated in a negative way, so that you can better define or monitor changing strategies.

And finally, let’s talk a little about recognition for a job well done.

Reinforce your system with reward KPIs

Standard setting is an important factor in a business’s success and an employee’s personal development, but is a reward system. After measure KPIs and determining than employee has successfully navigated the assigned tasks, it’s important to reinforce your employees’ efforts by established recognition practices that are directly tied to the original KPIs that were set.

Not only will these reinforce your system in place, it will further build confidence in your managerial skills and your business model. Never take for granted that no matter what systems are in place, strong relationships with your employees will only solidify your action plans and drive you much further along the road to success.

Read more about reward KPIs:

Data for the real-time morale KPI on your scorecard

$
0
0

We were talking before about the difficulties associated with measuring soft skills like leadership or feelings like engagement. While engineers are working on even more sophisticated wearable devices, there is an easier way to find out how people feel. You can simply ask them! For sure, the best way is to conduct a professional survey, but it doesn’t make any sense to do it weekly or daily. There are some easier means!

Morale monitoring with Daily Pulse

How do you feel about this presentation?

I was attending a conference for business strategists. After a questions and answers section, people were leaving the conference room for a coffee-break. A girl that was assisting the organizers was standing next to the exit door with an iPhone in her hand. There was some simple app running that permitted visitor to select a happy, neutral, and an unhappy smiley face. That was the only function of that app. After a short chat with organizers I’ve learned that they found this method to be the most efficient in order to get any feedback.

People were leaving the room right after the presentation, and with that app organizers were trying to measure emotions that people had at that very moment. Those who liked the presentation pushed the positive smile, those who did not like it pushed the neutral or negative one. It was more efficient than sending out survey forms after the event. People tended to ignore these requests or fill in the forms rapidly without thinking about the answers. But that app worked great for organizers.

Measuring employees’ morale

I saw another implementation of this idea recently. Barcelona-based company Celpax developed a device called DailyPulse. This device is placed on the exit door and it allows employees to answer one simple question: “How was your day?” People can choose among two buttons – red one and green one, respectively giving negative and positive responses.

Daily pulse device on exit door

The device connects via GSM to the server and make the mood statistic available for HR specialist online. In simple words, this technology makes the installation of the device easy anywhere in the world where GSM is supported, so if you have a mobile coverage then it will work for you.

Why people press the button?

Just like in the example mentioned above people shared their opinion about presentations via iPhone app just because it was easy. The same worked for DailyPulse, the device is on the exit door and… why not press the button, when it is so easy?

Another motivation is to check out the option of other people who pressed the button. The results will be shown only after the button is pressed. In this case curiosity stimulates people to participate.

Keep track of employee mood in real time

Business model

The developers of DailyPulse provide one device for free, which allows people to try it out and see if it provides useful inputs for HR. Those who like it can update to the premium account or buy additional devices.

PROs and CONs of morale indicator on the scorecard

Obtained daily data can be used for a morale indicator on the business scorecard. There are certain advantages and disadvantages of this approach.

PROs

  • HR specialist and other top managers can get  morale indicator data in  real time. It is obvious that any decision made in the company will be reflected in this indicator. This device helps to get a “yes/now” answer to the question, “Did employees like the proposed changes?”

Daily Pulse online monitor

CONs

  • It is obvious that the resulting data won’t be 100% accurate. There might be hundreds of reasons why people pressed a green or red button, so an HR specialist needs to work with this data carefully.
  • The device asks a yes/no question, for sure these results are not comparable with the results obtained from the professionally conducted survey with carefully prepared questions.

Conclusion

  • The benefit of having real-time information about employees’ morale will certainly help decision makers, but it should be analyzed carefully and supported by regular professional surveys that would deliver more in-depth results. I like the way Rebecca from Celpax explains the difference:

We see ourselves too different from surveys to be compared, we are more in the business of simplicity and DIY (do it yourself). A heart rate monitor might not be a medical checkup, but all athletes use one to improve. It tells you how your training went, if you’re getting fit, we kind of do the same… Both are related to health, but not really comparable.

Morale KPI in BSC Designer

We have contacted the developers of DailyPulse. An interface that will permit an integration is on their development plan, so hopefully soon users of BSC Designer will be able to automatically import data from DailyPluse into their business scorecards.

Morale KPI on your scorecard

For now, an HR manager can enter morale KPI data into BSC Designer scorecard project manually. You can create a “Morale KPI,” set a weekly or monthly update interval via initiatives, and enter the data regularly into the value field of the KPI.

I’m interested in hearing your opinion about the DailyPulse device and the idea in general. Have you tried something similar? What was your experience, and what features would you suggest for the developers of the DailyPluse device to implement?

10 tips about using business scorecard and KPIs for ongoing quality control

$
0
0

Although a business or balanced scorecard is not a quality control tool, we see among users of BSC Designer that many professionals apply the KPI scorecard and specifically use a Balanced Scorecard approach for ongoing quality control. In this article I summarize some of the best practices that I can recommend according to case studies that we did with our clients. Feel free to share your thoughts and experience about quality indicators on a scorecard in the comments section.

1. Business context comes first, then come indicators

Before you start thinking about the quality indicators, analyze your business context:

  • Why do you need to measure the quality?
  • What aspects of the quality are important to your customers?
  • How exactly the company is planning to achieve current business goals?
  • What quality-related problems need more attention?
  • What are the business challenges of your company right now?

The answers to these questions will help you to align your quality indicators to the specific business problems. In this way you will start defining your “quality strategy.” Strictly speaking, there is no separate quality strategy, but an idea of the quality can be integrated into other generic strategies. For example, if we are talking about Product Leadership as a strategy, then the defect rate might be on the scorecard. If executives chose to follow a Customer Intimacy strategy, then a “First time resolution rate” might work as an indicator aligned with one of the business objectives from the “Customers” perspective.

Business goals for quality control

In BSC Designer: go to the “Business goals” tab. There you can formalize your business goals and objectives, specify cause-and-effect connections between them. Later you can align KPIs with these goals and visualize them on the map.

2. Visualize your processes

Quality control or speaking more generally, quality assurance, is not only about having a set of indicators and reporting them. The idea is to have an understanding of the process, its strong and weak points, and trying to prevent possible quality issues. One needs to do a regular analysis of the quality challenges, their reasons and possible solutions. The result of this analysis needs to be formalized in the form of a flow chart.

Visualize your process on quality process map

In BSC Designer: go to the “Strategy Map” tab, create a new map and use it to visualize your process. Later you will be able to visualize some KPIs directly on this map.

3. Balance between lagging and leading indicators

Have a look at the flow charts created in the previous step. On  each step there is some input used and some result produced according to the defined standards. You can have quality indicators associated with those control points.

There might be leading or lagging indicators. Lagging indicators tell you a story of what has happen, this information is useful, but you are just observing what happened and you cannot change anything about that. In  contrast, leading indicators reflect inputs that influence the process. On your scorecard you need to have both – leading and lagging indicators.

In BSC Designer: from the viewpoint of calculations, lagging and leading indicators are the same, the difference is in their business meaning that you provide as a user.

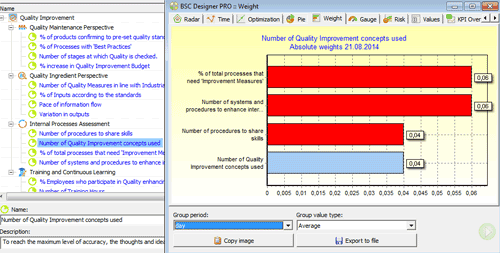
4. What are the most important indicators?

You answer: “All of them are important!” The question is: are all of them equally important? Reducing defects number from 0,01% to 0,001% might slow down the whole production system, while your clients were happy with a 0,01% defect rate, and for them the parameter of specific product function is much more important. You need to find a balance and reflect the differences between how important  each of the indicators on your scorecard are.

The weight of the most important quality KPIs

In BSC Designer: you have a weight property for an indicator. Check out an article that explained how to use it.

5. What is the performance of an indicator?

Let’s say you have 1% defect rate, then you optimized the process and achieved a 0,1% defect rate, finally, after an introduction of additional quality measures you got a 0,01% defect rate on average.

My question is: how was the performance of the respective quality indicator changed? Was it improved 10 times, and then again improved 10 more times? Not necessarily! From a  business viewpoint clients might be unhappy with a 1% defect rate, and really happy when you have a 0,1% defect rate, and achieving a 0,01% defect rate may not have make any visible difference for them.

In  real life some indicators have a linear performance function (you improve the value of an indicator 10 times and the performance improves 10 times), or the performance of an indicator might grow slowly in the beginning and then the function converts into an almost flat line, meaning that further improvements don’t improve the end performance. Remember this when you design your indicators and set targets for them.

The performance of quality indicator decreases linearly with the increase of the value

In BSC Designer: there is an “Optimization” drop list, where you can change linear optimization function to a more relevant one for the measured aspect of the quality.

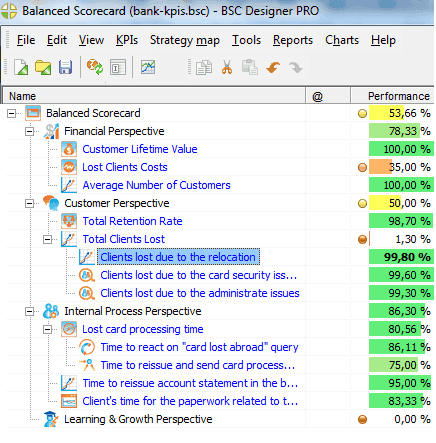
6. The total score of the quality scorecard

When you have 50+ indicators on your quality scorecard, each with its own performance function, benchmarks, values, and weights, then theoretically you can calculate the performance of each category and then the performance of the whole scorecard. As a result you will have a single number (in this case we might call it a “quality score”).

I know some top managers ask for a single quality score, but in the most cases it won’t make any sense, as this number aggregates too much data. It looks nice in the reports, but it won’t give any meaningful information for a top manager. The better option is to group indicators into categories and report the performance of each category.

The total score of quality scorecard in BSC Designer

In BSC Designer: the program can calculate the performance figures for a container and for the whole scorecard, but the end usage is up to you.

7. Plan you actions

Be sure that you have (preferably in writing) some plan aligned to each quality indicator. What will you do if this indicator gets into the red zone? Are there any routine procedures associated with this indicator? How often do you need to revise this indicator? Who is responsible for an indicator?

Initiatives and action plans for KPIs on quality scorecard

In BSC Designer: select an indicator or business goal, click “Initiatives” button, attach some relevant documents, choose a person responsible, and specify required update interval for an indicator.

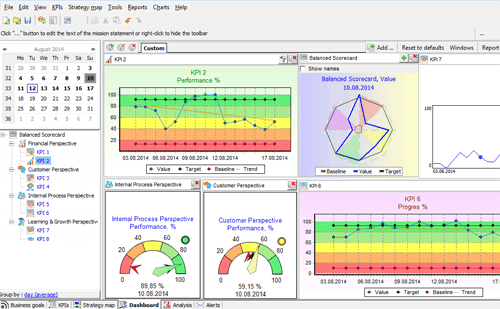
8. Build a quality dashboard

Dashboards help to visualize quality indicators. For some of them you will need to use a gauge-style chart, for others the best option is to display time chart with a trend line. A well designed dashboard will give you a top level view. Use it together with indicators visualized on the map. For more dashboard-related ideas, check out Dashboards Insight.

Put quality KPIs on a dashboard

In BSC Designer: you can create a number of dashboards to visualize your indicators or business goals there.

9. Track the trend

Even if you check your indicators regularly you might miss out on a negative trend. For that purpose track indicators’ value for longer periods of time. For example, taking a 3 month period as a base for calculations you might see that an indicator is trending into a red zone. This will serve as an excellent early-warning signal for your team.

Trend analysis of quality-related KPIs

In BSC Designer: “Time” chart has a trend line on it. Also, you can use “Forecast Analysis” on “Analysis Tab” to forecast indicators’ value.

10. Make sure you get bad news early

If some quality indicator has gotten into the red zone and this indicator is critical for the ultimate quality (if it is not, why is it on your quality scorecard?), then make sure that all of the stakeholders get a notification about the problem immediately.

Get quality alerts early

In BSC Designer: on “Alerts” tab one can setup alerts that will be sent to the person responsible, or to the manager if an indicator is in the red zone.

General recommendations about quality metrics

On the Internet you might find some ready-to-use quality metrics, like these packs. Be careful about using these indicators, they aggregate some best practices about measuring quality, but your business does not necessary need them. The best approach is to pass through the steps 1-3 as described above and create indicators that are specific for your business.

What approach to quality indicators do you use in your company? What are your favorite quality KPIs?

Viewing all 184 articles
Browse latest View live