Quantcast
Channel: Balanced Scorecard Software – BSC Designer
Viewing all 184 articles
Browse latest View live

How HR Can Boost Their Credibility By Using KPIs

$
0
0

The HR profession is being forced into some serious soul searching.  It’s predicted that most low and many mid ranking HR roles are at risk of obseletion, due to software automation alternatives.  As if this wasn’t enough to contend with, we also know that mid to higher ranking HR executives are still struggling to secure a seat at the executive table. The HR profession is being squeezed at both ends, and I believe it requires a sharp change in direction.

Boosting HR Credibility with KPIs

HR needs to move into the new world

If HR is to find new ground and a space in which to operate and be valued, it needs to extricate itself from the traditional HR world, where HR decisions are based on gut instinct and immerse itself in the new world of big data where decisions are based on hard data.

It may not be what the more touchy-feely HR profession is comfortable with, but hard-data-backed decisions, are what will gain HR credibility in the boardroom.

How do we know this? A KMPG white paper reported on HRZone.com reveals that 85% of C-Suite executives claim their HR teams, ‘fail to provide insightful analytics’. This creates a sense of uncertainty and distrust.

A Forbes article shows that HR teams who operate in a culture of data backed decision making are 4 times more likely to be respected by their business counterparts.

It’s clear that data backed insights and decision-making is the way forwards for HR professionals at all levels.

And if HR professionals don’t live and breathe data analytics it may be time to change profession, as this is what the industry is demanding from HR. But if you do want to engage with data analytics, and be an HR professional delivering data backed insights, where should you start?

From reactive to proactive reporting

According to Bersin, most HR professionals are at Level 1, which is reactive and ad-hoc HR Reporting. If this is where you are, you are behind the curve. You need to be getting to Level 2, which is proactive reporting, as a bare minimum, if you are to impress the CEO.

This involves operational reporting for benchmarking and decision-making and multi-dimensional analysis and dashboards.

At the very least, you should be deploying a set of HR KPIs that are attuned to your business, which feeds a digital dashboard that can sit at the heart of your decisions.

The starting place for HR data analystics

Where should you start? Implementing KPIs and digital dashboards has in the past been a laborious process, but like many other processes in HR, software has automated and simplified much of the digital dashboard generation process.

  • BSC Designer is a tool that has been designed to make HR KPI deployment and digital dashboards generation relatively easy.

It really makes very little sense to try creating dashboards without software given the efficiencies it affords.

But, before you go into BSC Designer you’ll want to spend a bit of time background researching and developing a powerful  and relevant set of KPIs upon which to guide your HR team and business.

10 Standard HR KPIs

Now, the exact KPIs that you use may vary according to the nature and size of your business, but these 10 standard HR KPIs represent a good starting point for any business until you can craft a set of your own customized KPIs:

  1. Performance of New Hire in 6 months
  2. Speed of Hire
  3. Quality of Hire
  4. Time To Productivity
  5. Percentage difference in productivity before and after training
  6. Percentage of employees that participate in career coaching
  7. Profit per employee
  8. Voluntary turnover
  9. Involuntary turnover
  10. Involuntary turnover high performers

KPIs backed insights are clearly more persuasive

Just one glance at these KPIs hints at the superior influencing power you will have at you disposal if you are implementing them. For example, what sounds more convincing to a CEO?

I need more training budget!

versus 

There was an 8% increase in productivity after training and so can we roll it out to the other departments?

or,

We need to invest more in HR!

versus

Our profit per employee has increased 12% since we started doing appraisals 4 times a year, so can we roll this out across the board?

Data backed insights are clearly more persuasive!

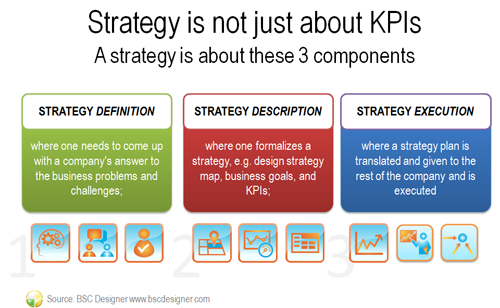
Integrate KPIs into business scorecard

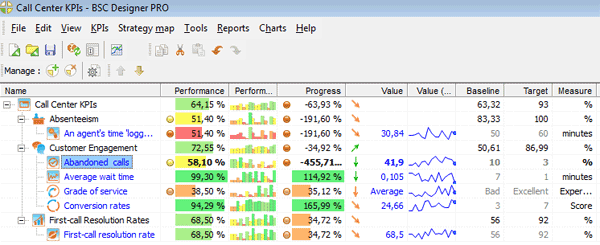
Having developed your KPIs it is time to start integrating them into a KPI management tool. This is where BSC Designer can help you. You can go into BSC Designer and quickly input your list of KPIs. The system comes with a core set of major business performance areas of: Financial Perspective, Customer Perspective, Internal Process Perspective and Learning & Growth. (These may vary within your own business and you can adjust as needed).

You can then easily go into this system and incorporate your HR KPIs under the appropriate business heading and this also helps to ensure that your indicators are aligned with business strategy.

If your KPIs are not able to align with core business performance areas you may need to ask yourself if these are the correct KPIs to be using.

While using a software tool like BSC Designer simplifies the KPI process, it doesn’t automate the whole thing for you. As a modern HR professional  committed to data backed decision-making you’ll need to have good grasp of arithmetic and basic data principles like: percentages, weightings, actual value, baseline, min, max. But, don’t be to concerned as it’s all stuff you would have covered back in High School.

You’ll need to do a little bit of setup at the beginning when using a tool like BSC Designer which includes entering each KPI, including benchmarks such as, £1,000 profit per employee. Don’t worry, there are easy to follow video tutorials to help you set it up and understand the BSC Designer system. Once set-up you can then update the system with the actual HR performance figures such as actual profit, actual turnover etc…

Digital dashboard for HR

This is where using a system like BSC Designer really shows it worth. You can now see the fruits of your gentle labour to set it up correctly, as BSC Designer will automatically create a digital dashboard for you in seconds.

HR Dashboard in BSC Designer

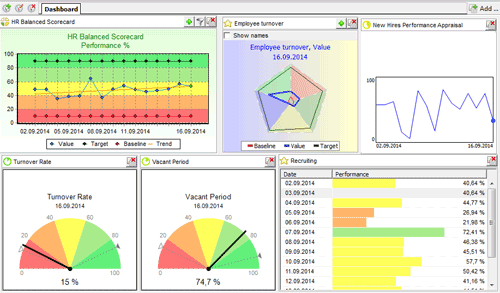
This would take hours to complete and maintain in Excel. These dashboards can of course be used to enable you to track and monitor the performance of your HR organization against key benchmarks, giving you the capacity to make data backed insights and decisions which will be the first step to HR claiming it’s rightful seat in the boardroom as a valued business partner.

Reference

  1. The Future Of Employment: How Susceptible Are Jobs To Computerisation? Carl Benedikt Frey, Michael A. Osborne, September 17, 2013, http://www.futuretech.ox.ac.uk/sites/futuretech.ox.ac.uk/files/The_Future_of_Employment_OMS_Working_Paper_1.pdf
  2. Poor data hampers HR’s boardroom reputation, Janine Milne, 26th February 2013, http://www.hrzone.com/topic/technology/poor-data-hampers-hrs-boardroom-reputation/129480
  3. Big Data in Human Resources: A World of Haves And Have-Nots, 2013, Josh Bersin, http://www.forbes.com/sites/joshbersin/2013/10/07/big-data-in-human-resources-a-world-of-haves-and-have-nots/

Call Center: Building 3 Most Important Attainable KPIs

$
0
0

Good communication is crucial for building trust among a consumer base. And in today’s economic environment, it’s a call center that acts as the lifeblood of a business that requires forward-facing contact with a public audience.

They can make a company stand out, attracting and retaining customers because of positive interactions with clients, or they can destroy crucial relationships and damage a brand that was once considered very promising.

Call center agents are the first contact a customer has when they call into a company. They aren’t simply receiving calls, collecting information, they are a company’s brand representatives.

Call center KPIs in BSC Designer

To best understand how to best utilize a call center, you have to go beyond simply developing a business strategy or “vision” for that role.

Representatives must understand how valuable of an asset they are, as well as how they can be successful in their duties, both individually and for the company.

That’s where key performance indicators (KPIs) establish the expected level of success, and determine how to continuously improve the agent and the customer experience

The biggest problems facing call centers

Before we get to that, let’s take a look at three of the biggest problems facing call centers today:

Сall center goals and KPIs

1. Absenteeism

Data suggests that the average annual absence rate—personnel out of their chars—in call centers is approximately 11 percent, globally. That means, that given 1,000 person call center, 110 of them aren’t even in their seats to help callers. Obviously this negatively impacts quality of service because of increased wait times, morale issues among other agents, and eventually the companies bottom line.

2. Customer Engagement

Call center work-life can become monotonous. And not only is it repetitive, callers can sometimes be verbally combative and downright hateful, making it even more stressful. These act as triggers that can drive agents to lose enthusiasm, become demoralized, or provide terrible customers service. This is also a factor in absenteeism.

3. First-call Resolution Rates

One of the most important factors in achieving customer satisfaction is first-call resolution (FCR). If an agent has to repeatedly send customers to different people to answer questions, the customer experienced begins to deteriorate and satisfaction wanes. This usually happens because an agent isn’t properly trained or doesn’t fully understand their duties. And once again, this is where KPIs become a factor.

Key Performance Indicators

Now that we’ve discussed three of the challenges facing call centers and their agents, let’s tackle KPIs and how they can be used to help improve individual agents as well as customer service. Additionally, we’re going to show how BSC Designer can help a business track these KPIs and make them more efficient and effective.

Just for simplicities sake, we’ll match our KPIs with our three biggest problems. Let’s start with absenteeism.

KPIs for Absenteeism

As noted earlier, when you’re unable to track those folks that can’t seem to sit still, you’re unable to see who isn’t holding up their end of the workload.

Training each agent on how much their individual performance impacts the queue, the customer experience, and the overall business strategy. Then, establish concrete standards and objectives that each agent is required to uphold.


Gauge chart for agent logged-in time indicator in BSC Designer

For example, a KPI would be setting a standard for:

  • an agent’s time ‘logged in’ and
  • available time,

which, for most call centers, is approximately 54 minutes out of every hour.

Further define the KPI by developing appropriate priorities for the wide range of tasks your agents perform on the job; priorities that help dictate how they spend their “down” time. With 1,000 employees, it may seem a difficult task. By utilizing BSC Designer’s easy-to-understand Balanced Scorecard, you can not only monitor and track their performance, you can measure their adherence to your set standards. This also allows you a better understanding of your call centers goals and your agents’ ability to reach success.

KPIs for Customer Engagement

As discussed, if people aren’t in their seats or if they’re there and not providing great customer service, they’re just wasting time and negatively impacting your company. That’s because customer satisfaction is one of the most critical metrics for any contact center.

Studies show that there is a direct correlation between customer satisfaction, loyalty, and corporate revenues, and employee morale and performance.

And while there isn’t a standard method for calculating satisfaction, there are plenty of KPIs that can be put in place to help measure communication success. By developing and establishing call protocols that determine greetings, use of titles, and other verbal queues, you can ensure your agents have a standard form of communication.


Time chart for abandoned calls KPI in BSC Designer

Furthermore, a manager is able to measure things like:

  • abandoned and answered calls,
  • average wait time, and
  • grade of service (through post-call or email surveys), and
  • even more important KPI measurables such as conversion rates.

First-call Resolution Rates

While it’s one of the biggest factors in overall customer satisfaction, it’s also one that is easily correctable. Establishing KPIs that dictate training and education is pretty straightforward, and using the BSC Designer to help you track these actionable items is even easier. You can track productivity in a variety of different ways, including graphs, percentages, graphics and even Excel data.

KPI here is:

  • First-call resolution rate, %

Not only will this improve your communication, it will provide your company with lower operating costs by reducing callbacks, it can reduce the risk of losing customers to competitors, and it will even provide your agents with a higher satisfaction because they’ll better understand their KPIs and their objectives.

It’s not only about KPIs…

Overall, it’s important to understand that establishing KPIs is only half of your strategy. Understanding how to measure and track those routines through use of the BSC Designer will help you take data and make it more effective. Because, let’s face it:

Your KPIs are completely ineffective if you don’t know how to leverage them properly and use them to reinforce your overall business strategies.

Use KPIs. Use BSC Designer. More importantly, let BSC Designer help make you a more effective, more efficient company, today.

Download the project of BSC Designer with the KPIs that were discussed in this article. To open the project you will need to download BSC Designer PRO.
Download .BSC Project

Feel free to share in the comments your favorite call-center KPIs.

3 ideas western executives can learn from Hoshin Kanri

$
0
0

Recently, I’ve announced an article about the Balanced Scorecard on LinkedIn, and I’ve got a comment that started intriguingly:

“Forget about Balanced Scorecard, get into Hoshin Kanri…”

I liked the discussion that followed and decided to give this business method a closer look. It is not a mainsteam, it is not as popular as other “lean” tools, and it is not so promoted in the form of workshops/certifications/books as is the Balanced Scorecard, but I think some of its ideas can be employed by any western executives.

3 Ideas to Learn from Hoshin Kanri

Some of my conclusions are formulated in this article. I had no intention to overload it with vague business jargon, definitions, and long argumentation about the best translation of Japanese words, but Wikipedia helps in this case; and instead I had several specific directions that I wanted to follow:

  • Explain what Hoshin Kanri is about without repeating high-sounding statements about strategic alignment
  • Compare and contrast it with the Balanced Scorecard
  • Give an example of how Hoshin Kanri can be supported by BSC Designer software

A little bit about Hoshin Kanri history

Japanese words “Hoshin” and “Kanri” literally mean “a method for strategic direction setting” and “management/control.” It was popularized in Japan in the 1950s by Professor Yoji Akao (the website of his colleague Karen Roberts is one of the starting points to learn about the Hoshin Kanri method). It was widely used by Toyota and claimed by many business authors to be a reason for Toyota’s success. In the Western world a significant role in the fame of the Hoshin Kanri was played by Hewlett Packard.

One thing before we start: there is no 100% agreement on elements and the processes of Hoshin Kanri; many schools and practitioners teach it in a different way. Needless to say we see the same uncertainty with other business concepts. I’m sharing a personal point of view on Hoshin Kanri (which might be affected by my background with business and balanced scorecards) based on what I have learned and what I saw while working with some of our clients who employed this method.

Hoshin Kanri without heavy business jargon

When reading books and articles about Hoshin Kanri I often had a feeling that I had heard this before.

  • The reason is that many authors are trying to pack Hoshin Kanri’s ideas into a new shiny box just arrived from Japan and claim that this method contains unlimited business wisdom.

Some authors overuse terms and dedicate whole chapters to the review of the terminology and finding sound analogies between Japanese and Western business management schools. Let’s try to understand what Hoshin Kanri is all about without talking too much about obvious ideas.

1. Plan-Do-Check-Act (PDCA)

PDCA cycle stands for Plan-Do-Check-Act. It is everywhere in Hoshin Kanri, one supposed to pass this cycle onto any business iteration.

  • One might say, “Hey! That’s what I have in my business! It’s nothing new!”

I believe the real gap here is that one needs to implementit consciously and systematically into all of the smallest (action level) and biggest (strategy level) processes and activities of the business.

  • For example: you write an article, and instead of just relying on intuition, you plan a/b test and get back with the results that prove what title works better for your audience.
  • You planned to increase your website traffic by 40% this year, but search engines had their own opinion about promotion methods that were used. After checking the results your company might reconsider its web strategy.

I’m simplifying things, but that’s where the difference is. No one will argue that Europeans can learn important lessons from Japanese PDCA cycle (also known as a key part of Kaizen).

Plan-do-check-act cycle in Hoshin Kanri

Some sources imply that Japanese companies (particularly Toyota) spend a significant time on the “Plan” part of PDCA cycle, paying much more attention to planning important things before actually releasing the plan.

2. Catchball – strategy discussion and alignment

In Hoshin Kanri terminology they call it “catchball.” In simple words, it’s the process of strategy discussion and alignment. Why invent a new term then? To underline the discussion nature of the process.

Catchball in Hoshin Kanri

  • It is not 100% top-down. Top managers don’t just articulate and translate their vision, goals, and objectives. It is more about discussion and brainstorming, analyzing and testing options, and getting back to the discussion (PDCA cycle, again!)
  • It is about alignment. The ultimate goal of “catchball” process is not to define a perfect set of objectives, but to find the way how these objectives can be measured, and what’s more important, how they can be aligned with specific actions.

3. Employees are accountable for achieving the results

As it was mentioned, participants of the Catchball need to agree on the processes and output measures. Using performance indicators is not anything new. The thing is that the alignment between business objectives and indicators, as well as assigning a person responsible, is implemented in Hoshin Kanri’s DNA, as well as the PDCA cycle is.

Employees metrics in Hoshin Kanri

Hoshin Kanri vs. Balanced Scorecard

While the Balanced Scorecard is so popular these days, we need to compare it to Hoshin Kanri, as we did before with 7-S and MBO.

Four perspectives

With BSC a company has a suggested scheme to describe a strategy:

  • It starts from desired financial outcomes,
  • Moving to customer values,
  • Describing internal processes that support these values and
  • Giving a learning and growth directions in the end.

On the one hand, in some articles Hoshin Kanri elements were compared with BSC’s perspectives, and there were some similarities. On the other hand, Hoshin Kanri has no explicitly defined perspectives, it is more process oriented (see the paragraph below). One can use the classic four perspectives from BSC, or perform his own cause-and-effect analysis putting some non-financial goals on the top.

  • Hronec (1993) in the example of the Hoshin process puts on the top level “Maintaining customer loyalty through rapid product introduction” goal. It is obvious that this goal is directly linked to some financial goals, so if needed it can be explained in BSC’s paradigm as well.

Strategy vs. Processes

From the first look at the keystone of the BSC are strategies together with high-level business goals, while Hoshin Kanri is more focused on the processes and key activities.

Some practitioners from BSC camp highlight this as a main difference that doesn’t allow Hoshin Kanri to be “strategic” enough. The thing is that BSC cannot be just about high-sounding strategies. In the end it needs to be cascaded to the departments, where specific low-level processes and measures will be aligned with the business objective. Sometimes these processes are told to be out of the BSC framework, but this doesn’t change the situation.

In the contrast, in the Hoshin Kanri approach we start talking about processes on the early stage, which makes this concept to look more practice-oriented and easier to understand/implement. High-level strategies might not be explicitly defined in Hoshin Kanri, but they are for sure implied.

Learning and growth

In Hoshin Kanri the learning component is formulated more explicitly. The heart of the concept is the PDCA cycle and it is everywhere. This provides a natural, never-ending education circuit, which supports finding some unexpected ideas, problems, and new solutions.

In BSC objectives from “Learning and Growth” perspective support objectives from higher levels. The rest depends on particular implementation. Some companies are serious about learning and implement some continuous improvement methods similar to the PDCA cycle. Another keeps the Learning and Growth perspective very formal.

I wouldn’t call it a disadvantage of BSC, but sometimes it is “too strategic” and forces its users to look for more business tools to solve their day-to-day problems.

They are more similar than distinct

If you take a look behind the heavy business and marketing jargon used to describe BSC and Hoshin Kanri, then we will see that there are more similarities than differences:

  • Both frameworks primary deal with strategic problems, not with everyday tasks
  • Both imply a cause-and-effect connection while the translation of high level strategies into smaller business goals (including those that are everyday tasks)
  • Both are supposed to translate the strategy into action

As BSC, Hoshin Kanri suggests to use a standardized set of the reports. As it often happens companies rarely follow these specific forms, following the ideas implied by these reports instead. Regular review of the performance against previously defined goals are normally done, but the form of these reviews and reports might be different.

Hoshin Kanri in BSC Designer

As it was shown above, the difference between the Balanced Scorecard and Hoshin Kanri is more conceptual. While both methods have their own unique features, from the view point of automation the picture looks very similar. It’s good news for users of BSC Designer that want to try Hoshin Kanri. Here is a short “translation” from the Balanced Scorecard mindset to the one for Hoshin Kanri.

Business goals

On the “Business Goals” tab one can describe the hierarchy of business objectives starting with strategies, vague business goals, and moving to the more detailed processes and key activities.

Hoshin Kanri Business Goals

Visual maps

Any process or activity that needs additional explication can be visualized on the “Strategy Map” tab in a form of a process map or something similar. Also, it is a good place to visualize a Plan-Do-Check-Act cycle, especially if it is specific for this process.

Process Maps in BSC Designer

Initiatives

The strategy discussion process (the Catchball) is normally supported by some standard business discussion tools (might be some brainstorming tool, simple Skype call or conference room meeting), however the key results and specific plans can be formalized in the form of “Initiatives” in BSC Designer.

KPIs

Finally, process and output measures that are an important part of Hoshin Kanri can be formalized on the “KPIs” tab. Moreover, it is easy to link these measures visually with business goals, and processes, even when they are visualized on the strategy map.

Metrics in BSC Designer

Here is an example of how Hoshin Kanri process might look like in BSC Designer. It is adapted from Hronec (1993) example of “Hoshin Kanri” process mentioned above.

Example of Hoshin planning process

Download the project of BSC Designer that was discussed in this article. To open the project you will need to download BSC Designer PRO.
Download .BSC Project

Conclusion: learn from Hoshin Kanri

In the end I’d like to give one example of how our perception might change the way things look:

Honda’s intervention in Western market of motorcycles was always given as an example of an excellent strategy planning (one of the explanation was given by BCG, Boston Consulting Group). Richard Pascale, co-author of The Art of Japanese Management (1981) did his own research. According to the interviews that he did with those managers who were the first to arrive in the US, the story looked a little bit different.

Having a short budget, and limited governmental support, four managers of Honda had to rent a cheap apartment in Los Angeles, two of them were sleeping on the floor. In the beginning their major promotion method was just to drive around to attract attention… According to their own words they had no specific strategy at all, just an idea about trying to sell in the US.

I think it’s a good idea to remember about this example when the next magic-pill-style business method appears. Still, I believe any business professional can learn something new from Hoshin Kanri:

  1. Implement a Plan-Do-Check-Act cycle more systematically, not just when the business gets into a problem.
  2. Discuss strategy, goals, objectives, measures and actions, rather than just translate them top-to-bottom.
  3. Systematically integrate learning into all business iterations, not just in the formal business training.

What do you think about Hoshin Kanri? Let’s discuss it in the comments.

References

Hronec, S.M. 1993, Vital Signs Using Quality, Time and Cost Performance Measurements to Chart You Company’s Future, AMACOM, New York

Savkin, 2013, BSC Designer, A Look Inside Global Executive’s Business Toolkit, http://www.bscdesigner.com/a-look-inside-global-executives-business-toolkit.htm

Richard Pascale, Anthony Athos, 1981, The Art of Japanese Management, Simon & Schuster

Is Your HR Strategy Aligned To Your Business Needs?

$
0
0

The HR profession has been in transformation for many years now. It was back in the 1990s that leading HR thinker, Dave Ulrich [1] put forward the idea that in order to become a respected business partner, HR needed to change.

It needed to move away from being a reactive profession, a kind of menial servant to the business – and move toward being a strategic business partner – challenging the status quo and providing proactive HR solutions to challenging business problems.

HR KPIs in BSC Designer

He called for the end of the HR Generalist and pushed for a new HR structure based around

  • HR administrators,
  • HR Specialists, (Reward, Hiring, Training, Employee Relations), and
  • Strategic HR Business Partners.

It was these Strategic HR Business Partners who were meant to use the HR Administrators and Specialists to devise strategic HR focused and business strategy aligned HR solutions to solve business problems.

If the IT department was failing to hit quality targets, the Strategic HR Business Partner would proactively develop an individualized HR intervention, using HR specialist and admin input to address the problem.

It was the Strategic HR Business Partner that was going to be the foundation of HR’s move from reactive servant to a valued top line contributor with a seat at the revered executive table. But, unfortunately, despite the lofty aspirations of HR, research suggests that the HR profession still hasn’t managed to make that move to strategic business partner status.

Many HR professionals working in senior HR roles might feel this is a harsh assessment, but studies support it.

This working paper, titled What Makes A Strategic Partner, by the Center for Effective Organization [2] outlines a longitudinal study of large firms which confirms that HR is not a business partner, and has made little or no movements towards becoming one.

How to become a strategic partner and relevant to the business

Dave Ulrich outlined six competencies that HR needs to master to be perceived as an effective performer. These were:

  • Credible Activist,
  • Capability Builder,
  • Change Champion,
  • Human Resource Innovator and Integrator,
  • Technology Specialist and
  • Strategic Positioner.

This latter strategic component was one of the top 3 skills and is what we will focus on here. There seemed to be three elements of being a strategic partner, according to Ulrich and these were:

  • interpreting global business context,
  • decoding customer expectations and
  • co-crafting a strategic agenda.

And to do this effectively, HR needs to carefully align HR strategy with business strategy.

Where to start…

But, these are lofty goals, which can seem intimidating but HR needs to start somewhere. I think the best place to start is by developing HR strategies that are closely aligned with the business strategy.

This will make HR relevant to and highly valued by the CEO and executive team, because the CEO and executives will be able to see how all your interventions are immediately relevant to their day to day concerns.

How to tell if your strategy is business aligned and relevant

You’ll know if you have developed a valued and business relevant strategy, because your CEO and executive colleagues will be engaged and excited by your plan as they will be able to see how it drives their business goals.

You won’t be a distraction, you’ll be eagerly awaited.

Developing and communicating your HR strategy in a persuasive way

BSC Designer can help you develop and communicate a compelling business strategy. It does this by enabling you to quickly produce a visual and diagrammatic presentation of your HR strategy and how it aligns to business strategy.

You can include the overall business goals of: Customer Perspective, Financial Perspective, Internal Process Perspective and Learning and Growth Perspective and you can visually present and align your HR interventions with these corporate goals.

This document can form the basis of a discussion between HR and a CEO or business colleague and provide a big picture view of how HR strategies and interventions are relevant to their business goals.

The CEO will be in no doubt as to how your HR goals are driving business goals and that you are always focused on this alignment. This will help make your discussion relevant, valued and persuasive.

You can see an example of a typical business aligned HR strategy map from BSC Designer below, which shows the four levels of high level business goals with each containing your HR strategic plans and progress against these plans (in the form of KPIs). This is a clear graphical presentation of HR strategic alignment.

An Example of HR Strategy Map

This particular BSC Designer strategy map is probably more suited to ‘big picture’ discussions with the CEO, but if you are liaising with functional heads you might want to have more detailed discussions around specific process areas such as recruitment and how that might be feeding into the technology sourcing strategy over the next year.

Using a process map is a great way to have this kind of discussion with functional heads and ensure that your actions and interventions can be seen and discussed in the context not only of their goals but in terms of corporate goals.

If you need to be telling a IT Director that he/she needs to change the type of person they hire, you’ll need to show the business context of your decision and how it drives business strategy if you are to persuade them. This is exactly what a business process map will enable you to do.

Overview of HR KPIs

What makes BSC Designer strategy maps such a powerful tool is that they are more than just pretty diagrams. Each strategy within the schematic has a dynamic KPI associated so you can easily view the progress or performance of initiatives in each strategic area. This means that BSC Designer is an excellent way to view strategy plans and progress in a big picture way within the overall business context – and to show the executive team that you are in control.

Download the project of BSC Designer that was discussed in this article. To open the project you will need to download BSC Designer PRO.
Download .BSC Project

BSC Designer strategy maps enable you speak in a strategic, corporate aligned business language increasing HR credibility and helping you position HR as a true strategic business partner.

References

[1] The State of The HR Profession, Dave Ulrich, Jon Youngers, Wayne Brockbank and Michael D. Ulrich: http://www.shrm.org/HRStandards/Documents/HRM 52 3.pdf

[2] What Makes A Strategic Partner, by the Center for Effective Organization (University of Southern California): http://ceo.usc.edu/working_paper/what_makes_hr_a_strategic_part.html

Top 3 problems with strategy execution in 2014 and how to solve them

$
0
0

Palladium Group has recently published their “2014 Global State of Strategy and Leadership Survey Report” [1]. The report is based on the research conducted within 1,266 organizations worldwide. The results give an idea about the general strategy execution climate today and how executives perceive current market changes. Here are some of the key findings and short comments from me.

Top 3 strategy execution problems

1. Business model needs to be updated

  • In 72% of the surveys executives answered that their business model “will be under threat in the next five years.”

As a response to these changes it is important to understand current and new business challenges, as well as a company’s strengths and weaknesses. I’m not talking only about SWOT analysis, but about mobilizing the skills and experience of your team to map out the current situation and problems that your company deals with. It might be a top-view strategy map detailed down to the specific business objectives.

2. There is a problem with vertical alignment

Another interesting fact:

  • “54% of respondents reported poor vertical alignment.”

In other words, the translation of the strategy from the top level down to the department level is not working well enough. Besides  using the Balanced Scorecard framework, I’d recommend to have a look at the “Catchball” process [2] from Hoshin Kanri, as properly implemented, it will reduce vertical alignment problems.

3. Choose a business tool for a strategy review

Balanced Scorecard as a strategy description and management tool is doing well. In November, 2013 I was writing about Executive’s toolkit based on the “Management Tools & Trends 2013″ report published by Bain & Company. Fresh data provided in the Palladium’s report confirms that Balanced Scorecard is in the list of the most used tools for strategy description. Here is what executives use:

  • 61% SWOT
  • 55% Financial Modeling
  • 49% Balanced Scorecard

I guess these numbers might be tricky, as people tend to call Balanced Scorecard any KPI scorecard they have, but it is clear that it is on the executives’ radars.

As for the subjective perception of the Balanced Scorecard, it is scored high:

  • 72% of the users of Strategy Map and Balanced Scorecard believe that the overall quality of their strategy is strong.

Companies with Balanced Scorecard are doing much better

According to the report the Balanced Scorecard is used by:

  • 55% of high performers, and
  • 7% of low performers.

Authors of the report conclude that “organizations using the Balanced Scorecard are 7.5 times more likely to be high performing.” As I commented to Palladium’s announce on LinkedIn, the cause-and-effect connection is not clear here. The Balanced Scorecard is used by these 55% high performers, but is not necessarily the reason for their high performance. Also, as it was told above, sometimes executives tend to call any scorecard a Balanced Scorecard, including ones that are focused on KPIs only.

Still, it is clear that those high performance care a lot about following a certain strategy execution scheme and that the Balanced Scorecard plays a significant role in this. I believe some part of their success can certainly be contributed to the proper usage of the Balanced Scorecard.

Recommendations for BSC Designer users

As far as I see it from the projects that our customers send to us, they are doing well. I saw projects with well developed KPIs and good strategy maps. Two recommendations that I’d like to give are:

  • Don’t limit your strategy maps to the top level views only. It is necessary to add some meaningful description in the form of “two or three-page Word document” as strategy execution expert Jeroen De Flander suggests or in the form of more detailed sub-maps, or both. With the recent update of the BSC Designer drawing and sharing process maps is now much easier.
  • Connect your strategies and scorecards even more. Make sure all of the departments know your strategic priorities, know how to achieve them and how to measure their success (see the “Catchball” paragraph in [2] for specific recommendations). Technically BSC Designer supports this alignment, but there should be a shift in how executives deal with their strategies.

I’m open for further discussion of the report, conclusions that we can make from it, and best practices one can employ to be more effective in strategy description and execution.

Reference

[1] “2014 Global State of Strategy and Leadership Survey Report”, http://www.thepalladiumgroup.com/Pages/dlRegister.aspx?ddid=2583, Palladium Group, Inc.

[2] “3 ideas western executives can learn from Hoshin Kanri” Aleksey Savkin, 2014, http://www.bscdesigner.com/3-ideas-from-hoshin-kanri.htm

[3] “6 ways successful leaders reinvent their Balanced Scorecard”, Jeroen De Flander, 2014, https://www.linkedin.com/pulse/article/20140910184614-1404807-6-ways-successful-leaders-reinvent-their-balanced-scorecard

Typical pitfalls along the Balanced Scorecard implementation and how to avoid them

$
0
0

There are a number of typical problems that a company’s strategist faces when implementing the Balanced Scorecard framework. Those pitfalls were widely discussed on LinkedIn and it seems that everyone agrees on why those are problems and how to avoid them. But when it comes to identifying and fixing those issues in our own business then it appears to be a tough task. With this article I’d like to start a systematic discussion of typical problems, the ways to diagnose them, and of course, the ways to solve them. I’m sure you have something to add, so feel free to share your thoughts in the comments.

Typical pitfalls of the Balanced Scorecard and instructions to diagnose and avoid them

Pitfall 1. One doesn’t understand the difference between “Strategy” and “KPI” scorecard

This mistake is a good starting point for this discussion. We often hear from users of BSC Designer software something like that:

  • “We’ve created a Balanced Scorecard, but it doesn’t work as promoted by various institutions!”
  • “We did a scorecard, but it seems that performance management doesn’t work for our company!”
  • “Scorecard is good to track KPIs, but it helps only a little with strategy execution”

After a short review it is easy to find out that they have a “KPI” scorecard, not a “Strategy” (Balanced) scorecard. The difference is that the first is a pure measurement tool and the second is a management tool.

  • A KPI scorecard might be or might not be aligned with proper objectives and actions.
  • In  contrast, Balanced Scorecard is about alignment between business goals, actions, and measures.

Similar mistakes

  • Having too many KPIs. Most likely they are not KPIs, but simple metrics (learn the difference).
  • Having KPIs that are aligned with neither strategy nor action. Here are some best practices.
  • Having only lagging indicators. You need to have leading indicators as well.
  • Having financial KPIs only.
  • Not using strategy map with cause-and-effect connected objectives.

Diagnosis of the mistake:

  • Review the “Similar mistakes” section to find out if something can be applied to your scorecard.
  • If your business scorecard consists of KPIs only, then you have KPI scorecard, not a Balanced Scorecard.

Solution to the mistake:

  • You need to shift from measuring to managing. Think about  how your strategic goals are linked to specific objectives. What are you going to do to achieve them (you action plan)? How are you going to measure the process and the results (KPIs)?
  • Read “The Strategy Focused Organization” [1] to learn the benefits of a strategy scorecard compared to a KPI scorecard.

Pitfall 2. Promoting silo thinking

Ideally, strategy should be everyone’s job in the company. In  practice we see that many promote “silo thinking.” Instead of discussing strategy and finding the best way to execute it and track the execution progress, top managers tend to isolate strategies from each other and from their employees. They want people to see only their part of the job, and as a result, it is not a surprise that strategy is not executed properly.

Similar mistakes

  • A Balanced Scorecard that you have is used exclusively by top managers
  • The Balanced Scorecard was prepared exclusively by top managers without working with those who will execute this strategy
  • Poor vertical alignment; according to the recent research, 54% of interviewed executives mentioned this problem.

Diagnosis of the problem:

  • Randomly select some employees in your company and ask them about the relationship between their job and the company’s objectives. Ask how they cooperate with other departments to achieve those objectives. If they know only their part of the job well and have only a rough idea about the answers to the other questions, then you are facing silo thinking problem.
  • A key test: was your excellent strategy executed properly? If not, then your strategy discussion process need to be updated.

Solution to the mistake:

  • When describing a strategy, involve not only top managers, but also those who will execute this strategy. Try adopting Catchball approach from Hoshin Kanri.
  • Make strategy everyone’s job. Translate the scorecard idea to the lower organizational levels.
  • When two departments collaborate, don’t use just a format SLA agreement. Try to align it with your strategy. For example, in the way it was described here.

Pitfall 3. Description of the bad strategy

Balanced Scorecard is not a strategy definition framework (although it provides some generic strategies); it is strategy description framework. It means that it will certainly help you to understand and describe your strategy better, but it is not a magic pill. If you have no strategy or you have a bad one [2], then you will just formalize your bad strategy.

Diagnosis of the problem:

  • Have a look at your strategy-related documents. Do you have a description of business challenges that you’ve been facing? Do you have an analysis of possible alternatives to address these challenges? Are these alternatives reflected on your strategy map, in your action plans, and in KPIs? If you are not sure about your answers, then it is a good idea to get back to the strategy itself.

Solution to the problem:

  • First learn to recognize “bad” strategy; Richard Rumelt’s book [2] is an excellent guide.
  • Start from scratch: what problems do you face; how do you think you might fix it; what you need to do; how you are going to track your progress. Learn from this case study.

Pitfall 4. Lack of buy-in

You have a world-class Balanced Scorecard, but the only active user is you. People tend to ignore new technologies and tools that they don’t understand. If you don’t have a buy-in from top managers and line-level employees, your Balanced Scorecard won’t work.

Similar problems

  • Low interest from top management and/or line-level employees
  • Participation of top managers only

Diagnosis of the problem:

  • Is the data in scorecard KPIs updated on time? Are business goals actualized?
  • Do employees use your strategy map when discussing some aspects of strategy?

Solution to the problem:

  • An actual solution depends on the implementation stage. If you are just in the beginning and you need to convince top managers, then show these statistics figures, as they look impressive.
  • Update your strategy discussion process as suggested in “Pitfall 2″; small discussion teams and catchball process will help to generate more meaningful ideas. The rest (the formal description of the strategy) will be much easier.
  • Solve the problem in Pitfall 3; before you can convince others, you need to have a clear understanding of the current strategy.

More pitfalls?

What do you think about these pitfalls? Have you faced any of them? How did you solve those problems? Would you like to add something to the list? Please share your thoughts in the comments.

Reference

[1] The Strategy Focused Organization, Robert S. Kaplan, David P. Norton, Harvard Business School Press, 2001

[2] Richard Rumelt “Good Strategy. Bad Strategy. The difference and Why it Matters”, 2012, Profile Books LTD

Problems with KPIs and how to solve them

$
0
0

Frustration: „Come up with the effective measures for each strategies“

Solution: There are some simple rules and algorithms that make this process easier. We discuss this in „How to design winning KPIs“ eTraining.

One of the best ideas that you can start using right now is not actually focusing on measures themself, but on goals you want achieve and on solutions that you will use to achieve these goals. Then it is easier to switch to particular measures and keep them result-oriented.

Frustration: „Setting up measurable and realistic KPIs that will align with our corporate objectives“

Solution: „Measurable“ and „Realistic“ are two important factors for good KPIs, but there are some more. For instance, KPI should be result-oriented. In the eTraining How to design winning KPIs we discussed simple algorithms that stake holders can use to design good KPIs. And for sure it is important to differentiate good and bad KPIs. Sometimes it is not possible at the starting point and KPIs need to be tested and optimized.

Frustration: „Based on a reusable template, setting up measurable KPIs for small companies.“

Solution: There are some reusable templates in the library of KPI, which are a good starting point for any company or department. More important is to understand that these KPIs might work for some company, but won’t work for other company from the same sector. That’s why just coping KPIs doesn’t work. Good idea is to invest in the education in this area. There is easy to go training for this: „How to design winning KPIs

Frustration: „Lack of proper HR KPIs and Customer KPIs“

Solution: The good starting point for HR KPIs is the library of KPIs, you can also find there KPIs for customers. This is something that you can start using right now and then optimize to your own needs.

Frustrations with buy-in of KPIs and BSC and how to solve them

$
0
0

Frustration: „The responsible person doesn’t want to be evaluated by the assigned measures“

Solution: The best idea to do in this situation is to analyze the reason why this happens.

  • Measure is not adequate. Measure was assigned by manager from higher level without collaboration with line-level employee. As the result the measure is not related to real job;
  • Many measures/bad measures. If there are too many measures or it takes too much time to calculate the value of the measure then the measure will not work.
  • Employee think that the value of what he or she does is not related to the measure. This option is similar to the first option. Try to understand where the problem is. Probably employee doesn’t understand real company goal, in  this case manager need to explain this goal.

We discuss more motivation techniques in eTraining: Motivation for the Balanced Scorecard.

FrustrationHow to sustain top management energy around monitoring of the metrics (KPIs). It is often hard to sustain top management energy around vigilant monitoring of the metrics. The more comprehensive we try to be with the metrics, the heavier management time is required.

Solution: The key here is in developing good metrics (discussed more in Winning KPIs eTraining). Normally, if the number of metrics or KPIs grow significantly it is a sign of information overload, which leads to loosing the focus.

If manager use 3-4 KPIs to measure results of achieving of one goal, then these KPIs should be checked and updated.

There might be the situation that KPIs were designed according to rules (they don’t repeat each other, they are descriptive, they are result-oriented, they are easy to measure), but there are still information overload.

In this case the solution is to use „Cascading“ (there is eTraining on this too). With cascading top managers will see only high level indicators and won’t loose the focus.

For instance, line-level employee might have 3-4 indicators for self-control, his manager might be using 2 indicators (which are combination of lower-level indicators) and the top manager will have just 1 indicator showing the overall progress.

We discuss more motivation techniques in eTraining: Motivation for the Balanced Scorecard.

Frustration: „Lack of participation in development strategies and BSC“

Solution: People don’t want to change their style of doing business, it is normally that most managers will not be happy when some new technique appears in the company.

The first goal is to show that Balanced Scorecard concept is not another hot business method that company will try and forgot. To do this company need to invest more in education of managers, also it is important that implementation of Balanced Scorecard should be supported by company owners and stake-holders.

The second goal is to actually show that Balanced Scorecard works and can make things better. When designing the Balanced Scorecard try to show that clear defined goals and measures are actually what will make the process more transparent and easier to understand and evaluate.

Frustration: „How staff bound to BSC“

Solution: This depends a lot on staff and the level of organization. The algorithm for the implementation can be found in Balanced Scorecard Implementation Guide.

The common mistake here is that managers design measures on their own. In is not the right approach. More important is to involve staff in this process. In this case people will be happy to work on and be evaluated according to measures they designed.

We discuss more motivation techniques in eTraining: Motivation for the Balanced Scorecard.

Frustration: „How to manage inclusion and involvement issues in big organizations“

Solution: Here are some ideas that should help:

  • Think about big organization as about set of separate business units.
  • For each business unit find stake-holder (who define goals of this unit), manager (who define and control real action), line-level employee (who do the job).
  • Don’t just create Balanced Scorecard, because you need to. Start with implementing it in certain business unit, where it is easier to measure processes and where the biggest results can be archived.

Frustration: „Lack of top management commitment when using Balanced Scorecard“

Solution: Probably one of the crucial problems, as finally stake-holders of the Balanced Scorecard are top managers.

Normally this happens when Balanced Scorecard doesn’t prove to be working concept. In this case it is better to go one step back and start with successful implementation of the Balanced Scorecard in the single business unit. We discuss more motivation techniques in eTraining: Motivation for the Balanced Scorecard.


Strategy-related problems and Balanced Scorecard

$
0
0

Frustration: Balanced Scorecard input into evolving strategy of the firm. BSC works best when put in the context of the organization’s medium to long term strategies. The system should make a stronger input into evolving the firm’s strategy which the BSC should support.

Solution: Actually the most important question here is how to make Balanced Scorecard to be a stronger input into firm’s strategy.

The answer is in the area of proper Balanced Scorecard implementation as well as in the area of motivation.

The Balanced Scorecard will make a strong input into firm’s strategy if top management will actually use the Balanced Scorecard. It was discussed in eTraining “How to build Balanced Scorecard”. One of the key ideas here is to involve both – top management and line-level employees on the stage of Balanced Scorecard design. In this case it will be possible to create measures that are understandable and useable by both – line-level employees and top management.

As for implementation side: the Balanced Scorecard should evolve with the company. E.g. plan to update the Balanced Scorecard regularly to fit company needs.

These two ideas will ensure the input of Balanced Scorecard into firm’s strategy and growth.

Frustration: Balance present and future strategies.

Solution: As company changes the strategy of the company changes too. There is no way to predict what company will be in 10 years and there is no way to design today the Balanced Scorecard that will work without any changes in the future.

What top managers of the company can do is plan the certain time period when the Balanced Scorecard in the company will be revised and updated accordingly to new goals. This question was discussed in eTraining – Testing the Balanced Scorecard.

When you designed your scorecard you have analyzed company’s current goals and designed the KPIs, maps, cascading and other as a result. The key idea about is refreshing your Balanced Scorecard regularly, e.g. analyze the biggest goals and challenges again and update KPIs and other parts of Balanced Scorecard if needed.

Frustration: Develop Strategic Scorecard for Group or Department.

Solution: Actually the Balanced Scorecard is normally developed for certain group (department) or for the whole company.

The algorithm for the implementation can be found in Balanced Scorecard Implementation Guide.

In short:

  1. Use your current organizational chart to understand who is playing manager’s role and who plays the role of line-level employee
  2. Manager should communicate with top management to understand company’s priorities and goals.
  3. Possible solutions should be defined that will help to achieve company’s goals.
  4. Manager together with line-level employee should develop KPIs that will be used to measure the efficiency of these solutions. The more result-oriented KPIs are the better!

FrustrationBalanced scorecard and measures for future strategies. I think the major problems that most of us often make are: we don’t know how to design as well as measure future strategies into a BSC, because we only think of present matters. And we often give a subjective percentage measurement.

Solution: Balanced Scorecard will not help much with planing future that top managers cannot see yet. But it can support managers with right decisions once they foresee some new goals.

Once top manager see some new goal that company might be willing to achieve, the Balanced Scorecard framework will enable linking this goal with actual actions of line level employees.

For sure there might be mistakes and some measure might be subjective, but the goal is to update the Balanced Scorecard regulary. Once it is more clear how the goal should be achieved and what measures should be used, the Balanced Scorecard should be updated.

Business Strategy and Balanced Scorecard Training

$
0
0

Welcome to our training page. I hope you are here not just because it’s another certificate to get, but because you want to formulate and execute your business strategy better.

3 components of strategy

Strategy is a way that a company sees: current business challenges, the reasons why they appeared; and the solution that will make everything work properly.

Strategy is not just about indicators (KPIs). I’d say that a strategy is about these 3 components:

  • Strategy definition, where one needs to come up with a company’s answer to the business problems and challenges;
  • Strategy description, where one formalizes a strategy, e.g. design strategy map, business goals, and KPIs;
  • Strategy execution, where a strategy plan is translated and given to the rest of the company and is executed.

The goal of our training is to give you specific approaches to work within these 3 components of the strategy.

Why us? What makes up special?

We are not a classical training company that packs just any information into a “Training/certification” product and sells it. Instead of having an academic background in the topic, we have a strong practical background.

  • We have helped companies all over the world to solve their management and measurement-related problems with scorecards. Check out the case study section to get an idea about who our customers are and what kind of problems they have solved.
  • We are authors of “BSC Designer” software for the business scorecard. That’s why during the training we are not talking about abstract theory, we are always trying to show how it works in practice. Still, we don’t insist on the usage of our software.
  • We have our own KPIs library, as well as a solid experience with designing KPIs that work.
  • Our trainers wrote books on Balanced Scorecard, their articles were seen on Forbes, and industry specific strategy magazines. You might have heard them speaking about the strategy at professional conferences.
  • We collaborated with business schools to teach business scorecards using working models.

There are a number of training products by other companies that focus on specific business framework only, for example, on the Balanced Scorecard. I believe that it’s always better to focus on the solution of the specific problems, not on the specific tool. We do this by following this principle:

We don’t teach just the scorecard approach; we teach you to work with all 3 aspects of the strategy (definition, description, execution) by using various tools. The Balanced Scorecard is just one of them.

  • We don’t teach Balanced Scorecard exclusively; we teach other business frameworks as well that help to address the above-mentioned challenges.

Why should I choose your training, but not one of these expensive programs?

There are various training/certification programs for the Business/Balanced Scorecard available on the market. Most of them suggest they are an excellent value and are taught by experienced lecturers. But let’s be honest, there are two kinds of training:

  • More expensive programs; their certificates give more prestige and value for your CV. The practical part of such programs is normally presented with some cases about scorecards implemented in international companies.
  • Less expensive practice-oriented training; their certificates don’t look so impressive on your CV, but give you skills that you can use right now, not just knowledge.

My personal belief is that any Balanced Scorecard training and certification is useless unless you start doing something yourself, and applying specific ideas that you learn about into your business.

  • It’s better to describe your strategy using a business scorecard and see how it works in real-life, than be a book-smart guru with knowledge that is not applied.

I always vote for practice. It’s like riding a bicycle:

You can hire the Olympic champion to teach you; you can read many books on the topic (yes, there are such books!), or visit expensive training, but the most important thing is that you start trying to ride.

For our training we don’t hire Olympic champions, but we help you to try all the ideas that we teach as soon as possible.

Do you teach “Business,” “Strategy,” or “Balanced” Scorecard?

Ted Levit once said:

  • People don’t buy a quarter-inch drill bit, they buy a quarter-inch hole.

Regarding the Balanced Scorecard I would say:

People don’t need Scorecard, they need a way to describe their complex strategies and then executive them.

For this very reason, in our trainings we are not locked to the Balanced Scorecard concept. It gives a lot of meaningful ideas about strategy description, but we can also learn a lot from other frameworks, like for example 7-S or Hoshin Kanri. For some companies, simpler approaches work much better than complex ones.

Answering the initial question about the terminology:

  • Instead of using “Balanced Scorecard” term we prefer to use wider terms like “Business” or “Strategy” Scorecard.

What will I learn?

There are 4 main directions. You can choose to focus on a specific direction or go through all of them:

  1. We will teach you to work with strategy, e.g. diagnose the problems and come up with a hypothesis about how to solve them.
  2. Business scorecard. Where we teach you to describe the strategy in a form of business goals, objectives, strategy maps, and initiatives.
  3. Where we are talking about leading and lagging indicators, finding them, and integrating them into your company’s culture.
  4. Where you’ll learn how to implement the idea of Business Scorecard into your company’s DNA.

I’d like to mention one important thing: our trainers do not stop learning! Every day we deal with another client, we see another scorecard or strategy map and we learn something new from them.

We don’t give recommendations like: “That is the way you have to do it.” Any business is unique and any concept needs to be aligned with its business realities.

We will diagnose which parts of your strategy process need more attention and suggest to you a training program to address those challenges.

3 formats of the training

We suggest you try 3 different training formats, and then choose one according to your budget and needs.

  • Web sessions at $150 US/hour rate. We will teach you via online meeting software (we use Skype and TeamViewer). Our agreement will be session to session, so you are never locked into a long term agreement, our team always has an incentive to make things happen.
  • Training on client’s site at $150 US/hour + travel and accommodation costs. This option works great for those clients that are already happy with our training and want to spread the ideas across the company. The most convenient way to do this is to bring a trainer to your site.

If you buy more than 1 hour of training then an hour rate will be reduced to the $120 US/hour.

If you are interested in web sessions or on-site training, then contact us first. Our trainer will get in contact with you to agree on the first free session where we will discuss your current business challenges and the details of the training program that would fit your needs best of all.

Finally, the last option:

  • Audio training in MP3 – starting from $216 US for the “Silver” package. If you have a tight budget, but still want to start with Business Scorecards, then you can choose one of the eTraining sessions. Check out the eTraining page, listen to audio samples, and choose the training that you need.

Collaboration with MBA programs

According to the research, the toolkit of the most World executives includes business scorecards. This explains a strong interest from the part of MBA students in modern strategy formulation frameworks. We did an excellent course about Business Scorecards for the Moscow Business School, and we are happy to share our experience with others.

The MBA class room is something special for us. On the one hand, we need to teach the theory of the concept; on the other hand, we want to share some practical experience.

To achieve these two goals we are using examples of real business scorecards, similar to those that companies use.

After “playing” with those projects, students become really enthusiastic about the Business Scorecard approach, and we believe that our first goal was successfully achieved in this case.

Certificate from us

As I mentioned in the very beginning, we are not for people who are just chasing another certificate to put on their wall or to add another line into a CV. Still, we are happy to recognize those who passed our training with a certificate.

BSC Designer Training Certificate

The certificate has its unique number, your name on it, and the name of the passed training program.

How can I start with a free session?

Just send us a message telling a little bit about your current business challenges, which might be:

  • Strategy definition
  • Strategy description with KPIs or strategy map
  • Translating of your strategy to other departments
  • Or something different

Then, we will agree on a time when we can meet online to discuss the training program that we can offer.

Do you have any other questions? Feel free to contact us or ask directly in the comments.

Key Risk Indicators (KRIs), Scorecard, and Template

$
0
0

Properly designed risk framework supports risk discussion in your company. It combines indicators that allow estimating risk probability, risk impact, and risk control actions. KRIs are not that different from KPI; Risk Management frameworks are not that different from the Balanced Scorecard. Let’s start the discussion about Key Risk Indicators best practices.

The idea of risk

What is risk and how can one measure and control it? Intuitively one understands that risk is something regarding a danger/threat that might happen with a certain probability and result in some type of negative outcomes. This perception is generally correct with one exception: risk doesn’t always need to be a threat for a business, it might be an opportunity as well.

The idea of risk

The older definition of risk in ISO was “a chance or probability of loss,” while the latest ISO 31000:2009 defines risk as “the effect of uncertainty on objectives.”

In other words, the modern definition of risk recognizes that risk is not only about threats, but about opportunities as well.

Losing your key employee might be a threat on the one hand, but on the other hand you might find a new one that will bring to your company new skills and ideas. Everything depends upon the business context (business objectives).

What are Key Risk Indicators?

As their name states, KRIs are indicators that are key for the risk management process.

  • “Key” word implies that there cannot be hundreds of KRIs; so if you have 100+ KRIs, then most likely these are just risk metrics.

Most of the principles that we discussed for KPIs (Key Performance Indicators) apply to KRI:

  • They need to have a proper business context,
  • Their need to be measurable,
  • There have to be a person responsible for KRI,
  • There should be a buy in from the team, etc.

Having said that, I recommend checking out the article: Why most KPIs don’t work and what to do about this. When reading, replace “KPI” with “KRI” and you can easily use all the same ideas and recommendations.

For now, it is enough to define KRI as those risk metrics that are an important part of your risk management portfolio. As it comes from the definition of the risk in ISO standard, the ultimate decision of what is and is not a risk depends on a company’s objectives, so be careful when copying KRIs from others.

The difference between KRI and KPI

In some literature KPIs and KRIs are strongly divided, the first are responsible for business performance and the second are about risk. As an example of a typical KPI that is not a KRI that is often used is “Net Profit.”

  • “Net profit is a KPI because it doesn’t tell us anything about the risk level or risk control!” – often suggest authors.

The thing is that “Net profit” by itself doesn’t tell us either anything about performance or the way one wants to increase it!

To make a use of “Net profit” we need to put it in a proper business context, add thresholds, baseline, and target marks, and add some relevant action plan:

  • KPI: “Net profit”
  • Current level: $200 K
  • Baseline: $205 K
  • Target: $300 K
  • Stop light: red
  • Action plan: “We failed because of the old sales team! Hire a new sales team!”

KPI vs KRI

Have a look at this KPI! Doesn’t it look like a KRI now? For sure, we don’t have metrics for probability and impact, but we can easily add them…

Another thought that supports the idea of the similar nature of KRIs and KPIs:

  • KPIs need to be aligned with the business strategy; and how one determined this strategy? Didn’t we use SWOT (where T stands for “threats”) method to come up with hypothesis (risk analysis) and possible solutions (risk control)?

Well, I’m exaggerating, but I personally don’t see any fundamental difference. I am ready to argue about this in the comments. For sure, KRIs are more “risk-oriented,” but if one needs, a KRI can be converted into a KPI and vice-versa.

Mapping risks to KRI. Defining Key Risk Indicators.

Here comes an interesting part. Let’s talk about Risk Management.  Managing risks is about managing the chain of:

  • Detecting/predicting threats/opportunities
  • Estimating the chance that they will happen (their probability)
  • Controlling the impact/outcomes

Normally, we cannot map all these aspects of the risk in one KRI, so we will normally need 3 indicators:

  • Indicator that would measure probability
  • Indicator that would measure the impact 
  • Indicator that would measure action plan

For example, for such KRI as “Poor mentoring of employees” we would have:

  • Time spend on mentoring per week, hours. This indicator estimates risk probability, the less hours one spends mentoring others, and the more likely the company will face this risk.
  • Employee engagement index, %. This indicator helps to understand the impact of poor communication. Less mentoring means less engagement from the part of employees.
  • Action plan: improve mentoring procedures; relevant indicator might be something like “Leadership training passed, hours.” We need to teach managers a proper leadership paradigm that would include mentoring.

Define and map KRIs

Which of those indicators is a KRI? I’d say that the pair of “probability” and “impact” indicators form the KRI. While the action plan indicator relates to the risk control procedures.

Template for a KRI

Here is a template that one can use for a Key Risk Indicator.

Risk Template:

Risk Indicators Risk Control Plan Action Indicator
Risk Identification:
______________
Probability Indicator: ________
Impact Indicator: _________
Action 1: _________
Action 2: _________
Indicator 1: _________
Indicator 2: _________

Example discussed above will look like:

Risk Indicators Risk Control Plan Action Indicator
Risk Identification:
“Poor mentoring of employees”
Probability Indicator:
Time spend on mentoring per week, hours
Impact Indicator:
Employee engagement index, %
Action 1:
Improve mentoring procedures
Indicator 1:
Leadership training passed, hours.

Leading/lagging KPIs vs. probability/impact KRIs

When mapping business strategy we always suggest making sure that there are:

  • Leading indicators aligned with business objectives,
  • Lagging indicators aligned with business objectives, and an
  • Action plan.

Compare this to the “probability,” “impact,” and “control plan” and you will see what I mean.

Properly described strategy looks very similar to the properly done risk and control assessment.

How do risks appear on the map? Reporting culture.

As business objectives are projections of properly defined strategy, risks are projections of a properly done risk analysis.

  • The basic step is to start with a classical risk assessment, drawing root-cause diagrams, brainstorming possible problems and getting a list of the risks as a result.
  • The most important step is to implement in your company a proper reporting culture. Employees should not only report about evident problems that already happened, but also about situations where they were lucky enough to avoid the problem, but it could have happened. Such reports will allow you to identify risks that you might have not thought about before.

Establish a culture similar to one in NASA: if the problem appeared once, they conducted a careful research about possible reasons why it happened; even if it did not repeat.

How to use risk assessment and control model

The risk assessment model that was described above is nothing new, but you need it just as you need a strategy map in business performance management. Specific numbers might be tricky and won’t give you a specific information. Why have this model then?

  • As strategy map helps to discuss strategy, risk assessment model/scorecard needs to be a base for further discussions related to the risk identification and control.

In this way you will implement risk control into the company’s DNA. It’s much better than regular formal reporting of KRIs that has nothing to do with real problems.

The list of the most popular KRIs

We have the list of 89 KRIs delivered both in .BSC (BSC Designer) and Excel formats. Don’t take these risk indicators as must-have for your business. As with KPIs, KRIs need to be aligned with business context, if not, then you will be evaluating and trying to manage risk that will never occur in your business.

KPIs in BSC Designer

In BSC Designer you can easily manager your KRIs. It can be a simple risk indicator with probability and impact properties:

KRI properties in BSC Designer

In this case BSC Designer can visualize necessary data on the risk chart:

Risk chart in BSC Designer

or generate an HTML report:

HTML KRI report

The main benefit is that indicators can be aligned with objectives on the strategy map.

Key take-aways

  • Risk is not just a threat, it is a business opportunity as well;
  • Put KRIs into proper business context;
  • KPI and KRI are not that different:
    • KRI need to be aligned with risk management strategy;
    • Make sure you control leading (probability) and lagging (impact) risk indicators;
  • Implement proper reporting culture;
  • Use risk scorecard as a base for the risk discussions;

¿Tiene una pregunta sobre BSC Designer?

$
0
0
BSC Designer ayuda en castellanoJuan Carlos Aranibar
Certificado por Palladium Kaplan-Norton en Execution Premium Process (XPP), Balanced Scorecard & Strategy Focused Organization (SFO). Tiene 14 años de experiencia en Balanced Scorecard (BSC) y Business Intelligence (BI).Autor de varios artículos sobre BSC y BI y del libro: “Sistemas de Información Gerencial para la Administración del Desempeño Empresarial. La Convergencia entre Business Intelligence y Balanced Scorecard”.

Tel.: +(591) 2 2623400 ext. 2265 | Mobile: + (591) 67005865

  • 25 cinco años de experiencia laboral en Tecnología de la Información, Sistemas de Información de Gerencial y Administración de Empresas
  • 8 años de experiencia en docencia universitaria  de BSC y BI
  • 10 años de experiencia como consultor y conferencista de BI y BSC, en 9 países de América Latina
  • Diseñador del módulo BSC de un software BI usado en Latino America y España
Formulario de Contacto
[contact-form-7]

KPIs for a Dental Practice

$
0
0

Find below the list of the ready-to-use KPIs for a dental practice. It makes sense using these KPIs as a part of your Dental Practice Business Scorecard. Learn more about building this scorecard.

New patient conversion rate

Use this KPI to find out how efficient your marketing system is. You will need to specify what lead is your qualified lead and then find out the conversion rate of the qualified leads into active patients.

New patient conversion rate

New patient conversion rate. Click for more dental practice KPIs.

Strategy objective

  • Improve the quality of marketing materials and initial treatments

KPI category: Customers

Target: 70%

Measurement: (New Active Patients) * 100% / (Qualified leads)

Amount paid per active patient per year

When choosing a new marketing method it is important to know what your current cost is to get a new active patient.

Amount paid per active patient per year

Amount paid per active patient per year. Click for more dental practice KPIs.

Strategy objective:

  • Gather relevant information to know the cost of attracting one active patient
  • Do a data-driven decision when choosing marketing methods

KPI category: Customers

Target: $80

Measurement: (Total marketing budget per year) / (The number of new active patients per year)

Dental Practice Profitability KPI

The goal of any business is profit. Besides providing excellent dental care, you run a business. You need to know the profitability of your dental practice before the owner’s compensation. The industry average benchmark is 40%.

Dental Practice Profitability KPI

Dental Practice Profitability KPI. Click for the detailed Balanced Scorecard.

Strategic objective: improve profitability of the dental practice

KPI category: Finance

Target:  40%

Measurement: (Operating expenses)/(Revenues generated)

Initiatives:

  • Analyze costs structure and introduce cost cutting measures if necessary

Annual production per full time employee

The annual production per one employee depends on where your dental practice is located. For the US, an excellent benchmark target would be $15,000.

Annual production per full time employee

Annual production per full time employee. Click to find more dental practice KPIs.

Objective: Track and improve employees’ efficiency

KPI category: Education and Growth

Target: $15,000

Measurement: (The total production, $) / (Number of full time employees)

Initiatives:

  • Introduce algorithms and standards to ensure higher operation performance

Treatment acceptance rate

You need to know how good your team explains to a patient a treatment’s risks and opportunities. Low treatment acceptance rate (industry benchmark is 50%) means that your team needs additional training and/or explicative techniques.

Treatment acceptance rate

Treatment acceptance rate. Click for more dental practice KPIs.

Strategic objective:

  • Make sure that patients accept suggested treatment in most cases
  • Train your team to present treatment plans

KPI category: Education and growth

Target: 50% and more

Measurement: (The number of accepted treatments) * 100% / (The total number of recommended treatments)

Initiatives: 

  • Design visually appealing explicative materials
  • Introduce training program to your team

 % of patients who leaves a dental practice

Control if the patience stops using the service because of the service price or quality or because of more natural reasons (such as relocation). If you find a problem you need to initiate quality assurance procedures, e.g. prevent similar problems from occurring.

% of patients who leaves a dental practice

% of patients who leaves a dental practice. Click for more KPIs.

Strategic objective: Do quality assurance to prevent patients from being lost in the future

KPI Category: Customers

Target: 5%

Measurement: (The number of lost patients per year) * 100% / (The total number of patients)

Initiatives:

  • Introduce quality control and assurance programs

% of new patients for dental practice

Any business loses a certain percentage of patients per year. To stay in the business and grow you need to find new patients regularly.

Percentage of new patients

Percentage of new patients. Click for more dental practice KPIs.

Strategy objective: Develop a marketing system that will promote your practice to new patients

KPI category: Customers

Target: 7% new patients per year

Measurements: (The number of new active patients per year) * 100% / (The total number of patients)

Initiatives:

  • Develop a marketing program

Dental Practice Overhead (Operating expenses) KPI

To make effective management decisions you need know your total expenses. Overhead includes operating expenses, rent, equipment, and utilities. Industry benchmark for overhead is 60% or less.

Dental Practice Overhead KPI

Dental Practice Overhead KPI. Click on the screenshot for more KPIs.

Strategic objective:

  • Control operating expenses;
  • Introduce cost-cutting measures where possible;

KPI Category: Finance

Target: 60% or less

Measurement: (Overhead expenses * 100%) / (Collections)

Initiatives:

  • Track overhead expenses
  • Develop plan to control operational expenses

Average Production Per New Patient KPI

This KPI shows how good you deal with new patients. Unlike old patients, new patients’ behavior indicates how effective your team and patient engagement efforts are. The basic approach is introducing to new patients not just a solution to the problem they have, but offering them a detailed treatment or prevention plan.

Average Production Per New Patient

KPI: Average Production Per New Patient. Click for more dental practice KPIs.

Strategic objective: Introduce to new patients the treatment plan, not just a solution of the actual problem

KPI Category: Finance

Target: 800$

Measurement: Treatment plan value, $

Initiatives:

  • Design  a “Welcome” pack that will include complex oral health exams and development of a treatment plan

Average annual production per active patient, KPI

Explain to patients at your dental practice the possible treatments that they could receive. Your goal is not just to solve the problem, but to provide comprehensive dental care.

Average annual production per active patient

KPI: Average annual production per active patient. Click for more Dental Practice KPIs.

Strategic objective: Increase average revenue generated by patients

KPI Category: Finance

Current: $500

Target: $800

Measurement: Measure the profit generated by one patient during a 1 year period

Initiatives:

  • Perform a complex oral health exam
  • Perform cosmetic dentistry evaluations
  • Develop and share with every patient a treatment plan

KPI for the number of whitening procedures

Whitening procedures have been reported to have a positive effect on patients’ engagement. Make sure your dental practice provides appropriate services. There are difference industry benchmarks on this. Some suggest having at least 1 whitening per day. Others suggest having 30% of available whitening procedures.

KPI: the number of whitening procedures

KPI: % of whitening procedures. Click to find more KPIs for the dental practice.

Strategic objective: Improve patient’s engagement

Category: Customers

Target: 25% and more

Measurement: (The number of whitening procedures) * 100% / (Total treatments per day)

Initiatives:

  • Promote any esthetic issues of whitening treatment
  • Explain any health issues of whitening treatment

Accounts Receivable KPI for dental practice

Studies show that you need to collect payments in a 2 month period, or your chances for successful collection go down significantly. These KPIs are applicable in the US and are less applicable in Europe. For example, in Spain, dental practices work on an upfront payment scheme.

Accounts receivable KPI for dental practice

Accounts receivable KPI. Click to find more KPIs for the Dental Practice.

Strategic objective: Improve payments collection ratio up to 98.5%

KPI Category: Customers

Target: 98.5%

Measurement: Percentage of due payments received after 2 months of the actual treatment

Initiatives:

  • Inform patients before the actual treatment about the fees for the treatment that they will have to pay
  • Introduce a possibility to pay upfront

% of facility and equipment expenses KPI for dental practice

What do you pay for rent and equipment? Industry benchmarks tell that these should be about 10% of the revenues. If your expenses are higher, it doesn’t necessary mean that you need to change anything.

% of facility and equipment expenses KPI for Dental Practice

% of facility and equipment expenses KPI. Click to find more Dental Practice KPIs.

Strategy objective: Control facility expenses

KPI category: Finance

Target : 10%

Measurement: (Facility and equipment expenses) * 100% /  (Total revenues per month)

Initiatives: 

  • No specific action required. Use this KPI for benchmarking purposes.

% of marketing expenses – dental practice KPI

What are marketing expenses of your dental practice? The industry benchmarks tell us that the value of the KPI should be able 10% of the total practice’s revenue. If you have 15%, it doesn’t mean that you need to change something. This might be business specific for your region.

Percentage of marketing expenses

Percentage of marketing expenses. Click to learn more about the Balanced Scorecard for dental practice.

Strategy objective: control marketing expenses

KPI category: Finance

Target : 10%

Measurement: (Marketing Expenses per month) * 100% /  (Total revenues per month)

Initiatives:

  • No specific action required. Use this KPI for benchmarking purposes.

Maisel Balanced Scorecard Model

$
0
0

The model by Lawrence S. Maisel was offered in 1992.  It has the same name as the model by Norton-Kaplan. Maisel also defines four perspectives based on which business activity should be evaluated.

Instead of learning and growth perspective Maisel uses human resource perspective which measures innovation, as well as such factors as education, development of production services, enhancement of competence and corporate culture.  It is possible to say that these systems have very slight differences. The reason why Maisel uses perspective of human resources is explained by the fact that the company management should be more attentive to personnel and measure not only efficiency of processes and systems , but also evaluate performance efficiency of employees.

Maisel BSC model was first introduced in the article “Performance Measurement. The Balanced Scorecard Approach”, in Journal of Cost Management.

Maisel BSC model

Maisel BSC model

Efficiency pyramid

$
0
0

In 1990 C.J. McNair, Richard L. Lunch and Kelvin F. Cross introduced a model which they called efficiency pyramid. The key concept of efficiency pyramid was connection of customer oriented corporate strategy with financial indicators, supplemented by several key quality (non-financial) indicators.

Traditional managerial information should come only from the upper level. Efficiency pyramid is based on concepts of total quality management, industrial engineering and counting based on actions.  Actions imply everything done by people and machines (equipment, mechanisms, computer systems) to satisfy customers’ needs.

Efficiency pyramid has four different levels that show organization structure with feedback and communication systems necessary for decision making at different managerial levels.  Objectives and indicators communicate organization strategy with its operational activity.  In other words, objectives are transferred top to bottom while indicators are gathered vice versa (bottom to the top).

Efficiency pyramid

Efficiency pyramid

At the top level company management formulates corporate vision.  The second level includes objectives for departments and subdivisions in accordance to a certain market and financial indicators.  Customers and shareholders define what needs to be evaluated.  The third level is virtually non organizational.  It consists of a number of aspects focusing on satisfaction of customer needs and flexibility of production process.  Indicators here are measuring customer and financial objectives.  The last level deals with quality, delivery terms, production cycle, losses etc.  Quality and time for delivery are related to external environment, while production cycle and losses are indicators for internal processes of an organization.

It needs mentioning that indicators in the bottom of pyramid are measured every day, every week or every month.  In the top of the pyramid financial indicators dominate, and thus they are measured not so often.  Of course, indicators in the bottom levels should be subordinated to indicators in the top.  This system makes it possible to show what financial indicators are based on, and what drives them.

This model was first introduced in Management Accounting magazine, the article “Do financial and nonfinancial performance measures have to agree?” in November 1990.


ЕР2M model – Effective Progress and Performance Measurement

$
0
0

In 1993 Christopher Adams and Peter Roberts offered another model which they called ЕР2M that stands for Effective Progress and Performance Measurement. The model is visually represented in the following scheme.

Effective Progress and Performance Measurement

Effective Progress and Performance Measurement

According to Adams-Roberts, the company should focus on the following 4 directions:

  • Serving customers and markets
  • Enhancement of internal processes (efficiency growth and profitability increase)
  • Strategy and changes management
  • Freedom of actions

This theory implies that strategic management has 2 consecutive stages: strategy development and strategy implementation.  Development of strategy is an analytical process which answers the question “What needs to be done?” Implementation is a two sided process: on the one hand this is organization process which answer the question “How goals will be achieved?” and “Who will achieve them”, while on the other hand it contributes to development of managerial skills and change management.

The goal of the system is not only implementation of company strategy.  The company management should also get used to the fact that frequent changes are quite normalEmployees who are involved in decision-making and implementation of strategy should be armed with effective feedback system.

What Role Can Reward Specialists Play In Boosting Employee Engagement?

$
0
0

Employee engagement levels all over the world are at an all time low. According to this study by Gallup, titled, State of the Global Workplace [1], which looked at 142 countries and 180 million employees, only 13% of employees are engaged. Or, if looked at another way, this means that a massive 63% of employees are disengaged and a worrying 24% of employees are actively disengaged.

But, what does all this mean in terms of real, day to day behaviour?

Well, disengaged employees lack motivation and won’t be working as hard and won’t go the extra mile, meaning they will be less productive, while the actively disengaged are unhappy and will spread negativity to others.

Intrinsic rewards overlooked

Motivational crisis in the workplace

With 87% of employees feeling this way, it is fair to say that the modern work-place is broken and is experiencing a motivational crisis. This means it is all hands on deck in HR, and every area of HR needs to pull together to deliver strategies to drive up employee engagement levels from the critically low levels that they currently sit at.

  • One area of HR that has not traditionally had such a strategic input into engagement and motivation is reward.

Why is this? Well, there has often been a bit of a turf war between HR and Finance when it comes to reward management. There is a battle for control. And, in organizations where finance leads the reward agenda, there can be more emphasis on numbers and less emphasis on motivational theory.

This is a limited approached to reward management as employees are motivated by not one, but two types of reward and these are

  • extrinsic (not part of the essential nature) and
  • intrinsic (belonging naturally; essential),

and financial measures only address the extrinsic need.

This means that with finance led reward agendas the intrinsic reward measures are more likely to be ignored and the business will be failing to deploy a total reward agenda.

It’s time for HR to lead and escalate the reward agenda

This is why the time is right for HR to step up and begin to lead and escalate the reward agenda and ensure a more holistic, total reward approach is adopted which addresses both extrinsic and intrinsic motivators. It is a perfect opportunity for reward professionals to take more direct responsibility for employee engagement.

Extrinsic and Intrinsic Reward Motivators

As we have hinted at earlier in the article a key way for reward specialists to boost employee engagement is to incorporate extrinsic and intrinsic rewards. As reward specialists, most of you will be very familiar with extrinsic rewards, like:

  • Pay rises,
  • Bonuses and
  • Benefits.

These of course do work and form a key part of a reward focused engagement strategy. But, modern day knowledge workers have been shown to also be motivated by four intrinsic rewards which they get simply from doing their job. These are having the following four feelings associated with their jobs:

  1. Sense of meaningfulness
  2. Sense of choice
  3. Sense of competence
  4. Sense of progress

Intrinsic Rewards Overlooked

What you are probably wondering is which is most important to overall engagement? Extrinsic or Intrinsic? This research taken from an, ‘Ivy League Business Journal’, white paper, titled, The Four Intrinsic Rewards That Drive Employee Engagement [2], shows that:

Over the last few years intrinsic rewards have risen in importance as key motivators, and extrinsic rewards have declined in importance.

In truth, both are still important but there is a continuing preoccupation with financial/extrinsic rewards at the expense of these psychological rewards among managers. This shows that the reward profession has a larger role to play in employee engagement, should it choose to accept it, and that is to educate managers and develop reward processes that deliver intrinsic as well as extrinsic motivators.

Developing a strategic reward agenda

Of course, in order for reward managers to progress to a total reward agenda they will need to influence and engage key stakeholders both from within and outside the HR team. It represents an expansion of the reward role into job design, which can touch on many other areas of HR such as employee relations, organisational design and clearly it will also impact line managers.

This is why this total reward agenda may be best deployed as a strategic change initiative.

This will require the reward agenda leader to develop a process for devising, monitoring and tracking intrinsic as well as extrinsic reward motivators.

Use BSC Designer to build clarity and focus around your strategic reward agenda

This is best done through the creation of a strategy map and KPIs which can be done very simply using a tool like BSC Designer. These strategy documents will form the basis of your discussions and communications with key stakeholders in the business. It will build clarity, purpose and a sense of commitment around your innovative reward agenda allowing you to initiate, drive and sustain it across the business.

Use BSC Strategy map to clarify strategy and alignment with corporate goals

For your reward agenda to be persuasive you’ll need to immediately demonstrate its relevance to managers and key stakeholders, using strategy maps from BSC Designer like is shown below. As you can see from the strategy map below, by moving towards total reward, (with intrinsic and extrinsic rewards), you will drive employee engagement/effort and boost productivity and output which will immediately show the stakeholders that your initiative is important to the overall strategy of the business.

Engagement strategy map

Use BSC Designer KPIS to monitor and encourage change

As part of the reward agenda, the reward strategists will need to devise interventions to ensure that there is a focus on developing the intrinsic and extrinsic motivators. But, you’ll need to develop some KPIs so you can monitor the progress of your reward agenda and see how it is impacting corporate results. The relevant KPI here would be employee engagement and this would be made up of 7 indicators linking to the employee’s intrinsic and extrinsic motivational levels. This is all represented in the KPI tree from BSC Designer shown below.

Employee Engagement KPI

You can of course use the BSC digital dashboard as shown below to track and monitor your intrinsic/extrinsic reward motivation levels and to communicate this to key stakeholders to show progress and areas where there may be a need for more effort.

Employee Engagement Dashboard

As you can see the modern reward professional has a very significant role to play in boosting employee engagement in the business. And this can be achieved by developing and deploying a modern strategic reward agenda which takes into account the contemporary shift in receptiveness towards intrinsic motivators and away from extrinsic motivators.

References

1. Gallup Survey; State Of the Global Workplace?, Steve Crabtree, 2013, Gallp World, http://www.gallup.com/poll/165269/worldwide-employees-engaged-work.aspx

2. The 4 Intrinsic Rewards That Drive Employee Engagement, Kenneth Thomas, 2009, Ivey Business Journal, http://iveybusinessjournal.com/topics/the-workplace/the-four-intrinsic-rewards-that-drive-employee-engagement

Potrebujete pomoc s BSC Designerom?

$
0
0

Miro. Pomoc BSC Designer.Miro Knižka je reprezentantom našich produktov v regióne Slovenská republika, Česká republika a okolie. Je držiteľom certifikátu BSC DESIGNER SPECIALIST a môže Vám pomôcť s technickou aj obsahovou stránkou Vašej Balanced Scorecard, jej prepojením a aktívnym využívaním.

Je špecialistom v oblasti HORECA a aktívnym členom HORECA GROUP SLOVAKIA, v ktorom sa špecializujú na tvorbu a vývoj softvérového zabezpečenia pre manažment.V odbornej stránke sa aj v rámci výskumu a spolupráce s viacerými univerzitami aktívne venuje moderným manažérskym metódam a ich uplatňovaniu.

Neváhajte ho kontaktovať:

+421 904 508 413

Hlavným zameraním sú metódy a manažérske nástroje ako Riadenie vzťahov so zákazníkmi, Riadenie interných vzťahov, Outsourcing, Kontroling, Benchmarking, Riadenie vzťahov s dodávateľmi, Strategické plánovanie, Core competence, Komplexné manažérstvo kvality (TQM), Balanced Scorecard, Six sigma, Activity Based Costing, Model výnimočnosti (EFQM) a iné.

Kontaktný formulár
[contact-form-7]

Reports in BSC Designer – Video Manual

Subscribe to Balanced Scorecard Lessons

$
0
0

We are not going to leave you alone with our software and books about the Balanced Scorecard.

  • We are going to follow up with you with lessons about the Balanced Scorecard.
  • Our goal is to teach you key ideas and
  • Show you how these ideas can be automated.

Download BSC Designer and get your first BSC lesson or subscribe to BSC lessons directly:

Viewing all 184 articles
Browse latest View live