Learn how to align big data initiatives with the strategy of your organization, and validate your efforts with Key Performance Indicators.
The end of the year is a good time to talk about emerging trends: self-driving cars, artificial intelligence, virtual reality, and the Internet of Things. What effect will these trends have on your business? How can you take into account a possible impact of these game-changing ideas? All the mentioned trends deserve a detailed analysis, but there is one that seems to be connected with all the others. I’m talking about Big Data. AI will need it, self-driving cars are based on it, and of course, it is already used by many businesses.
![Align Big Data Initiatives with Strategy Using KPIs]()
At BSC Designer we were talking a lot about KPIs and strategy. In this article I suggest discussing how a well described strategy and tailor-made KPIs can help to focus on big data efforts. Here is our plan for this article:
- Big data. What is it? What are the main challenges?
- KPIs for big data. 4 levels of KPIs and achieving strategic alignment.
- Action plan. Measurable implementation of big data.
What is big data?
Big data is about the analysis of large, unstructured datasets.
Big data can be characterized by 3 Vs:
- Volume. The datasets are supposed to be big. There are some estimations that it should be at least 10 GB or 1 TB, but probably a better criterion would be to say that big data is something that needs to be distributed (in terms of storage or computations). If you had to switch to Hadoop or a similar framework, then it is getting big.
- Variety. Think about different sources of structured and unstructured data. It can be mined from text, video, sales data, social media, weather forecast, or whatever makes sense in your context.
- Velocity. The high volume of the data is a result of fast data generation. Think about thousands of aircraft elements that are constantly monitored, or about a constant flow of the comments in social media, or about real-time data that wearable devices provide.
Often (take IBM or EY as an example), there is also a fourth “V” that stands for “Veracity:”
- Veracity. When we are talking about data, we are always dealing with a certain level of uncertainty. How was the data obtained? Did we analyze all factors? Was it manipulated? Can we trust those numbers?
How is the data used?
Big data is used for a wide range of predictive and behaviour analysis. Organizations apply big data to reduce costs, understand customer needs better, and to mitigate risks. Think about a business that uses big data to deliver a tailor-made experience for the customers; think about fraud-check of an e-commerce provider.
In the beginning of the article I mentioned some emerging trends – big data is involved in all of them. To learn more about practical use of big data, I recommend continuing with “7 Amazing Companies That Really Get Big Data” by internationally recognized expert Bernard Marr.
Main challenges of big data
The described vision of big data sounds very ambitious. Why then are companies slow in adopting this new trend? What are the main challenges of big data?
Data mining is not a main challenge anymore
Later in October, I was speaking on a conference organized by SCIP (Strategic and Competitive Intelligence Professionals). The members of this organization deal with big data in the domains of market intelligence. The main theme of the conference was not about mining some CI/BI data as one might expect, it was about aligning business intelligence efforts with an organization’s strategy. In other words, once a company knows the questions that it wants to ask, the rest is relatively easy (see the surveys below for some data).
If data mining is not a problem anymore, what are the main challenges?
Challenge 1. Focusing big data
The main challenge is to focus big data on what matters, and then deliver it into the right hands. In other words, there should be someone in the organization who should start asking the right questions.
To illustrate this idea let’s take a Target story that was on the headlines back in 2012. This retailer successfully used shopper analytics data to predict that some of their clients were pregnant. Let’s look at the story (not taking into account the privacy-related part) and see what actually happened. Andrew Pole, a statistician who worked for Target was not just delivering all possible data, he got a very specific task from his colleagues from marketing – identify pregnant shoppers in their second trimester.
There was a focus and, there was a huge business value associated with this focus, as new parents tend to change their buying habits and buy everything at one retail shop. It was not about just playing with data, it was about finding data that would help to answer a very specific question.
Challenge 2. Alignment with business strategy
Big data will be game changing when it provides tangible business value. In other words, it should be clear how the big data initiatives are supporting a company´s strategy. NewVantage Partners in their Big Data Executive Survey asked respondents about cultural impediments to Big Data business adoption. 42.6% of respondents chose the answer “Insufficient organizational alignment.” Other options included a lack of adoption, lack of coherent data strategy, and a lack of a shared vision.
Getting back to the Target case, they were successful at addressing two important components:
- Big data focused on a specific query: A data scientist was asked to identify pregnant shoppers in their second trimester.
- Alignment with a business strategy: There was a clear business value for the data – families where a child was born become clients of one retail shop for a long time.
Challenge 3. Data security and privacy
This challenge is not in mainstream usage yet, but I think it is obvious for anyone that data collection and analysis must be ethical and legal. General Data Protection Regulation (GDPR) becomes enforceable starting 25 May 2018 in Europe and there are similar regulations in other countries. Companies need to be much more serious about following data policies when processing personal data.
Let’s discuss the KPIs in the context of big data.
KPIs and Big Data
Is big data going to replace KPIs? Not exactly. The big data is going to power KPIs with more accurate and up-to-date insights.
Let’s take NPS (Net Promoter Score) as an example:
- NPS now. How is NPS (Net Promoter Score) calculated in your organization today? Probably you do some kind of customer survey on a quarterly basis. Thus, this indicator is lagging in time. If something happens to your business, the NPS will show it few months later.
- NPS powered by big data. Now, imagine that you use some big data tool that analyzes customer emotions in real time (see the Heedbook reference below). In this case your NPS will become a real-time KPI. Basically, you will be able to see the reaction of a specific client to a specific offer and to a specific sale approach.
In some cases, you will be interested in digging deeper into the data and getting to the specific situations, and in some cases you will need to see the aggregated data for the week, month, or year.
KPIs for big data
In the case of big data, we are talking about significant investments in the new tools and architecture, so it makes sense to monitor those initiatives with some hard data. The big data initiatives should also be quantified and measured. We can do this on several different levels.
Level 1. 3-V metrics
The 3Vs (Volume, Variety, Velocity) of big data can be easily quantified:
- Volume of data is a measure by itself (GB, TB, etc.)
- Variety can be quantified as the number of different types of data sources
- Velocity is defined by the volume of data generated/analyzed per time period
The fourth V – Veracity might be more difficult to quantify. You will need to define what your team qualifies as accurate data and that depends on the context. For example, for the combustion engine cars measuring of the current speed with an error level of +-5 km/h might be considered as accurate data, while for electric cars, it is not acceptable. Define 1-2 metrics that give an idea about data accuracy in your case.
Are the 3-V metrics useful? It depends on your context. Let’s take Google’s self-driving car as an example. The car produces 1GB of sensor data per second. That number looks impressive! We can estimate how big the big data, but those numbers won’t help us with the 3 challenges mentioned before.
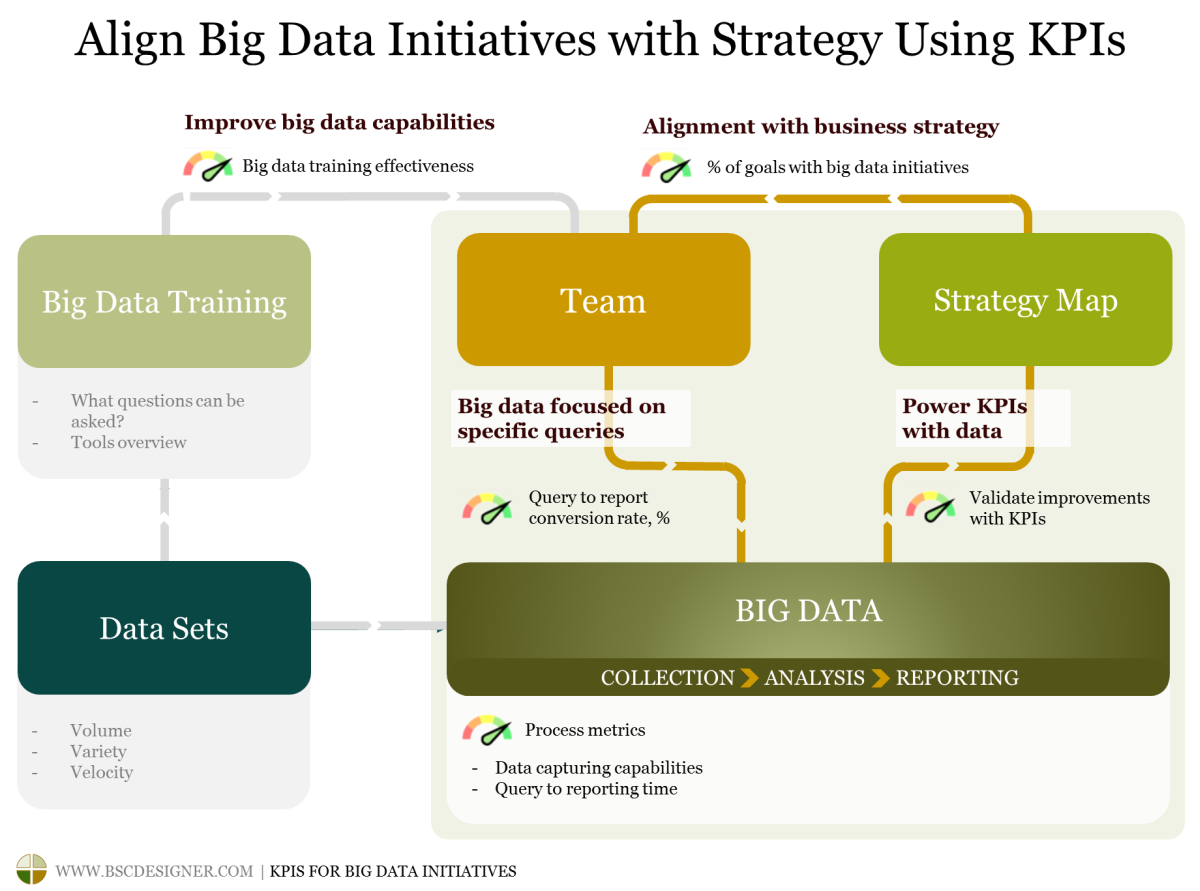
![BIg data KPIs in BSC Designer]()
View Big Data Scorecard onlineLevel 2. Big data process metrics
Let’s move to the next level of abstraction and have a look at the big data process. The simplified model is as following:
- Query
- Collection
- Analysis
- Reporting
The most useful metrics in this case are related to time:
- Frequency of data collection
- Time needed for data to be available for analysis
- Time needed for data to be reported in a form of KPIs
The benchmarks for timing depend on your business context. For example:
- The self-driving car needs to collect and analyze data in real-time, and the milliseconds of the difference matter, but
- In the case of NPS managers might be interested in reviewing aggregated weekly data
In terms of process efficiency, we can track the:
- Query to report conversion rate, %. In this case we must define the concept of a qualified query first, and then track the percentage of qualified queries that our data scientists were able to answer
- Data capturing capabilities. The accuracy level of the data that we capture (the ideas discussed above in Veracity).
The metrics from this level give us a better idea about how efficient big data is, but still, we don’t have a clue about the impact of big data on real business goals.
Level 3. Lagging KPIs. KPIs to validate big data success.
Another question is how to validate the success of big data initiatives in the company. On the one hand there are some significant investments in infrastructure, on the other hand big data should be paying back in the form of business insights. How can we measure a dollar value of those insights?
In this case we need to track the improvements that can be credited to using big data:
- What lessons do we learnt from big data? What cost saving was achieved after implementation of those ideas?
- How did the customer retention rate change due to delivering a tailor-made experience? How is customer lifetime value changing?
- Does big data help customer service to be more effective? How did the first-call resolution rate change?
- How did the hiring processes change after starting to use big data? How did the time to performance HR metric change?
As you can see on this level we use classical KPIs that we were using before. What we are trying to do is to credit certain improvements to the implementation of big data.
This approach might be biased:
- We tend to count positive changes as our achievements and
- We see negative changes as normal fluctuations that always happen.
The solution is to aim for bigger and more tangible targets.
Many organizations skill this measurement part and simply buy “some big data.” According to the report by Capgemini Consulting, 67% of the interviewed companies do not have a well-defined criteria to measure the success of their big data initiatives. Considering the amount of investment, companies should be more systematic in defining the goals and the success criteria of big data implementation.
![Big data initiatives on the map]()
View Big Data Scorecard onlineLevel 4. Leading KPIs. Ensuring big data success.
Now we know how to measure the outcome part of big data initiatives, but what about the leading part? What should we do to ensure a successful implementation of big data?
The hard part of the big data is quite tangible, we can measure it by such generic metrics as:
- Funds invested in big data initiatives
- Time spend on big data initiatives
Business goals focus big data
Here is a real scenario: a company invested millions of dollars in the infrastructure, tools, and big data collection with the Hadoop cluster, and nothing measurable happened. That’s what we were talking about in challenge 1: Big data is not AI, it cannot speak, and your team need to learn to ask the questions. How can we measure the role of the team then?
Here are some ideas to get started:
- Big data training effectiveness. Make sure that key members of your team have had some training on big data. They are not necessary becoming data scientists, but they need to know what questions they can ask and how to formulate those questions. The metrics in this case will be related to training effectiveness.
- % of strategic goals with big data initiatives. We could track the number of big data queries formulated by each team, but this approach would be very formal and less useful. A better option is to track the alignment between goals and big data queries. Ask your team to look at their strategic goals and then discuss what data they might need to make better decisions in the context of those goals.
Big data helps to formulate new business goals
The process of matching business context and big data is bidirectional. Sometimes we have a specific challenge in mind and then are looking for specific big data tools (like in the case with Target), sometimes we find an interesting tool and then try to match it with our goals. Here are some examples:
- Someone in your team found Heedbook, a service that analyzes customer’s emotions in real time. The service is built on Microsoft’s Azure and is available in the Cloud. Your client service team might come up with an idea to use this service to calculate their NPS better.
- Your IT personnel were challenged with finding a DLP (Data loss prevention) software. They came across SearchInform that not only can analyze communications and transmitted files, but can also enforce specific security policies. The IT strategy of your organization can be updated by taking into account the possibilities of the DLP tool.
In any case, it is a good idea to match specific business goals with the requirements for the big data.
Action plan. Make big data measurable.
Let’s formulate some takeaways from this article. I prefer to do it in the form of an action plan.
- Revise big data. How the data is collected now, what data capturing capabilities you have (use the big data process metrics as a framework).
- Do your homework. Have your strategy formulated on the strategy map, and cascaded to the business units. Review your current KPIs.
- Improve capabilities. Plan the initiatives to address the team’s capabilities in terms of big data. Key members should understand what questions they can ask, and how to formulate those questions.
- Focus big data efforts. Review your strategy map, spot the opportunities where the big data can support business goals. Formulate big data queries.
- Implementation. Analyze the insights delivered by big data, reflect them in the form of KPIs where needed.
A short guide for users of BSC Designer software
As a user of BSC Designer you have a powerful software that will automate many of the strategy alignment and KPIs aspects discussed in this article:
- Strategic alignment and focusing big data. Create a strategy map to present your business goals; align KPIs with the goals on the map. If you don’t have a strategy map yet, then use a strategy map wizard to get started.
![Online wizard will help even inexperienced users to create a professional strategy map with business goals, KPIs, and initiatives.]()
Strategy Map Wizard – Balanced Scorecard in 6 Minutes
Answer simple questions - build a professional strategy map in 6 minutes.
Strategy formulation and description might be a time-consuming project even for an experienced strategist. This Strategy Scorecard Wizard will make the whole process fast and intuitive.
Learn more!Start now!- Ensuring that a team has big data capabilities. Use a training scorecard (you can start with this example) to make sure that your team has the necessary capabilities for working with big data.
- Powering KPIs with big data. Track performance metrics for the big data initiatives; use RESTFul API to enter real-time big data reports into the indicators.
If you are not a user yet, then you can start with a free trial version of BSC Designer, which is available online.
Use Big Data Scorecard project discussed in this article as a starting template for your own scorecard! Access this example project
online or download
.BSC project file for BSC Designer PRO.
View Big Data Scorecard onlineReferences
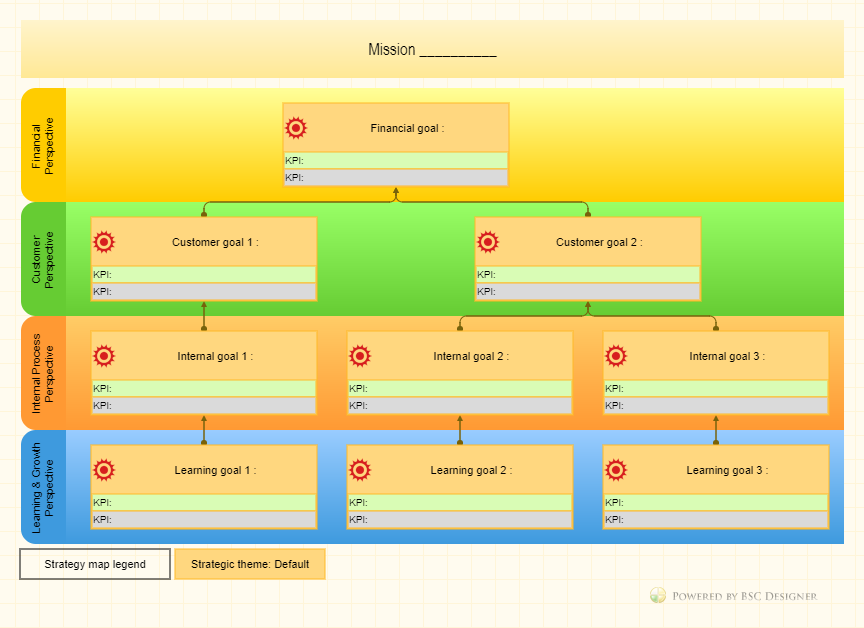

 A business goals structure presented in the 4 perspectives.
 It will also align information about initiatives and action plans with your goals and KPIs.
 A structure of the KPIs presented in the four perspectives.
 A strategy map with business goals, KPIs, and initiatives.