Quantcast
Channel: Balanced Scorecard Software – BSC Designer
Viewing all 184 articles
Browse latest View live

Training Videos for BSC Designer Online

$
0
0

On this page you will find training videos for BSC Designer Online. There is also an online manual in text format. Should you have any questions that were not covered in these videos, please contact us directly.

Getting Started with BSC Designer

Welcome to BSC Designer Online. Learn more about how BSC Designer Online works.

Training video: Introduction in BSC Designer Online

How to setup KPIs

Training video: KPIs in BSC Designer Online

How to start using a template

Training video: Using BSC Template

How to create strategy and process maps

Training video: Strategy Maps with BSC Designer Online

How to create dashboards

Training video: Dashboards in BSC Designer Online

How to formalize business goals

Training video: Business Goals in BSC Designer Online

How to setup alerts

Training video: Alert in BSC Designer Online

Analyzing the performance of KPIs

Training video: KPIs Analysis In BSC Designer Online

Load data into KPIs from MS Excel

Training video: Importing data for KPIs from MS Excel

Setting access permission for scorecards

Training video: Share Scorecard with BSC Designer Online

How to cascade scorecards by business goals and KPIs

Training video: Cascading in BSC Designer Online

Surveys and data series

Training video: Data Series in BSC Designer Online

Managing users

Training video: Managing Users in BSC Designer Online

Performance reporting

Training video: Reports with BSC Designer Online

Organizing scorecards in your account

Training video: Organizing Scorecards with BSC Designer Online

Account administration

Training video: Account Administration in BSC Designer Online

Step-by-step from a business model to the Balanced Scorecard

From a business model to the strategy map - step by step video


How-to Measure Innovations with KPIs

$
0
0

One of the challenges that business owners face when planning a business strategy is measuring how innovative an organization is. Learn how to approach this measurement challenge with KPIs. 
How to find good KPIs for measuring innovations

The lagging part of the innovations is relatively clear, we can measure the number of innovative initiatives that became successful in some time or measure their financial impact. But what about the leading part? How can the leading metrics can be formulated in the domain of innovations? How can we predict that the company will create these innovations?

What company will never innovate?

Let’s formulate the opposite question:

  • What is a profile of a company that most likely won’t be able to innovate?

These are the companies where:

  • All new ideas are rejected,
  • The barrier for approving new ideas is too high,
  • The bureaucracy dominates over common sense,
  • Where short term profits are more important that long-term value for the customers,
  • Where employees are always busy with firefighting and simply don’t have free time to think about something new, and
  • Where informational silos limit the exchange of information between the departments…

We can go ahead and list more behavior patterns that have negative influence on the innovative potential. My point is that the innovative companies will do exactly the opposite things. Do you need to measure how innovative your company is? Quantify and measure those behavior patterns.

Don’t forget about the stakeholders:

  • Who might suggest an innovation? Employees, partners, clients?
  • Are the members of your team using your product or service as end-users?
  • How actively can your team experiment?

There are always some good ideas out there, the question is if you team has the time and resources for the experiments.

How innovative is your environment?

The basic metrics might be:

  • The number of ideas suggested by the team over a period of time
  • The percent of the ideas turned into experiments
  • Dedicated time for the experiments

Where do those ideas come from? In the previous chapter [see 10 Step KPI System book], we agreed to divide inputs and success factors, but the inputs always correlate in some way with the success factors. What might be the inputs for the innovation?

  • Do the members of your team read the books in their domain, visit conferences?
  • Can we expect that someone who visited a conference can write down a list of 5 ideas that your team can try later?

That’s easy if someone watched the presentations and networked with colleagues!

Innovation funnel

Having discussed how the companies innovate (and don’t innovate) we can build an innovation funnel. It will be something like:

  • Insight > idea > discussion > experiments > prototype > product > commercial success of failure.

If you ask any entrepreneur about the number of his or her successful projects, you would hear something like 3 of 10 projects fail, 6 of 10 are poor performers, 1 of 10 is where we can achieve excellence. What do these numbers tell us in terms of innovation?

To be able to succeed with 1 project, your team will need to fail at least with 9 other projects.

And make sure your teams are really trying and not giving away some random projects as failures.

Innovations and rewards

Should we reward someone for generating good ideas? I would be careful with this. I shared my point of view on the financial rewards in the “Reward scorecard” article. And I believe that immediate financial motivation in this case won’t drive any good behavior. Focus on the non-financial ways to award the person. At least recognize his or her contribution to the idea.
10 Step KPI System Bookshot

Find more ideas in the new book

Aleksey Savkin, author of the book about KPIs – “10 Step KPI System. A time-proven approach to finding tailor-made KPIs for the most challenging business situations” where he shares his best practices for dealing with the most challenging business situations using KPIs. The book will be available on Amazon this summer, and is already available on Lulu

10 Step KPI System – Download

$
0
0

Dear readers of the “10 Step KPI System!” Thank you for visiting the “Downloads” section.

Download 10 Step KPI System TemplateDownload 10 Step Template

Use this link to download the print-friendly version of the 10 Step KPI template:

Once downloaded print the template on A4 size paper for the best fit.

Other resources

Here are some other resources that were mentioned in the book:

Submit your feedback on the book

We will be happy to hear your feedback about “10 Step KPI System” book. Feel free to send your feedback via a contact form.

Buying more copies

If you are interested in buying more copies of the book then you can do it here:

10 Step KPI System – Book Page

$
0
0

How to find KPIs that will be right for our organization? How to measure performance, ROI, values, and quality? In the “10 Step KPI System” book by Aleksey Savkin, you will find some actionable insights and examples. What is more important is that this book will give you a system that one can use to find winning KPIs that are tailor-made for their organization.

10 Step KPI System - Front Cover. A Time-proven Approach to Finding Tailor-made KPIs for the Most Challenging Business Situations.10 Step KPI System - Back Cover. A 10-step brainstorming template is included in the printed and downloadable formats.
What are the steps of 10 Step KPI System?

  1. Define measurement prism. How to break-down intangibles like “performance” and “quality” into more measurement parts.
  2. Detect blind spots. There are some typical traps with the KPIs, learn how to find and avoid them.
  3. Find constraints and success factors. What is limiting your business? What could help your business to be successful?
  4. Observe and set up experiments. How to set up experiments when something cannot be measured.
  5. Set up KPI´s scale. Learn how to calculate indicator’s and scorecard’s performance data.
  6. Prioritize indicators. Do you have too many good candidates for the KPIs? Learn how to prioritize your efforts?
  7. Find leading and change metrics. The best goals are those that help you to do things differentely.
  8. Self-test for measurement. What behaviour do your KPIs induce?
  9. Decrease the cost of measurement. Learn how to make systems measurable by design.
  10. Build strategy map and scorecard. Use your new KPIs to build and cascade a scorecard.

Book’s bonus

The Appendix 1 of the book is “10 Steps KPI System Template Checklist.” In the print version you can find it on page 155. This template is a tool that will support your brainstorming efforts when you will need to search for new KPIs tailor-made for your organization. You will also be able to download the print-friendly PDF version of the template. Use it to engage more members of your team in finding winning KPIs:

Book's bonus: Download 10 Step KPI System Template

Where to buy

The “10 Step KPI System” book is expected to be available in major online stores by summer 2017. Right now you can buy it directly from the Lulu.com both paperback and eBook version:

Firsthand experience with BSC Designer software in Athens, Greece

$
0
0

Meet BSC Designer team in Athens, Greece for the firsthand experience with BSC Designer software, practical tips about business scorecards, and KPIs.

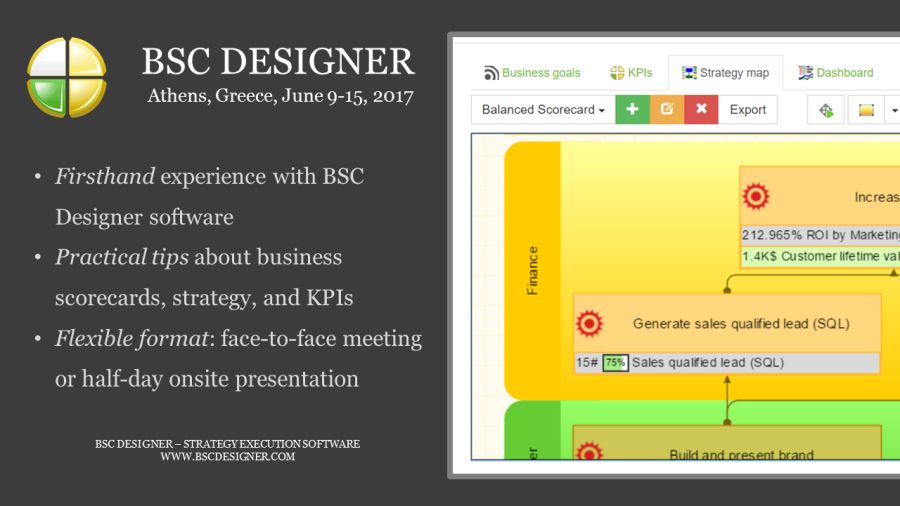
BSC Designer Roadshow in Athens, Greece, June 9-15, 2017. - Firsthand experience with BSC Designer software

BSC Designer roadshow in Athens, Greece

Place: Athens, Greece

Dates: June 9-15, 2017

Topics:

  • Firsthand experience with BSC Designer software
  • Practical tips about business scorecards, defining and describing strategy, KPIs

Formats:

  • Informal face-to-face meetings
  • Half-day onsite presentation

How to sign-up:

5 Easy to Implement KPI-Related Ideas that Drive Immediate Results

$
0
0

We’ve recently gotten a comment to “10 Step KPI System” book:

“I have found some good ideas, but in our organization I simply don’t have enough political weight to try all of them…”

In this article, instead of focusing on all possible improvement tactics let’s focus on ones that are relatively easy to implement, but drive visible improvements in a short period of time. In a case of success, the person who suggested those tactics will gain some political credits and prepare ground for future improvements.

5 easy to implement KPI-related ideas that drive immediate improvements

1. Find metrics for the bottleneck

Among all possibilities, focus on those parts of the business system that are limiting your performance. Thinking in this way will help reduce the number of less useful metrics and focus only on those few indicators that are actually “key” for your business.

Sometimes this approach looks like fire-fighting and some long-term perspective might be ignored, but at least your team will be clear about where the priorities should be right now.

2. Identify change metrics

Knowing what is limiting your business is a good starting point, but what is even more important is to understand how to extend these limits. Look for the ways to change, and respectively find the metrics that will help to confirm that you are on the right track with the changes.

For example, delivery service might find out that their bottleneck is the number of trucks on the route. A change goal in this case might be switching some deliveries to a delivery service with drones.

You might argue that delivery with the drones is a significant innovation, and it’s hard to find something similar in our niche. That’s true, but at least your team will now know where to focus their innovation efforts, and what changes can drive significant performance improvements.

3. Show the power of funnel metrics

Many organizations have a goal of improving profits by X% next year. One of the ways to make this goal more tangible and actionable is to build a funnel model.

Funnel metrics for 3 levels in BSC Designer Online

View 5 KPIs Tips Demo Scorecard online

For example, if we are talking about a sales funnel, then the right questions can be:

  • How well is our business attracting potential customers?
  • How well is our business generating leads?
  • How well are the leads being converted into paying clients?
  • Draw a money/value/customer flow and use it to understand what can be improved. Small improvement on each level of the funnel will lead to significant improvement in overall performance.

Let me use some simple math to illustrate the power of funnel metrics. For example, we have a 3-level sales funnel with a 5% conversion ratio between each level. On the first level, there are 10,000 prospect customers (for example website visitors), then there are 500 qualified leads (for example, those who downloaded the white paper), then there are 25 sales. The overall goal is to increase sales by 20% up to 30 sales. One way to do this is to increase the number on the first level by 20%, but we can also work with the conversion ratios.

What change in the conversion ratios would give us a desired 20% increase? 20%? 10%? No! Actually, in this case we just need to increase both conversion ratios by 0.5%!

The good thing is that we can build a funnel model for any aspect of the business from sales to innovations.

4. Practice “KPI freedom” with a team

A lot was said about the importance of the culture in the organization, including the performance measurement culture. In my book, I talked about the ways to change the culture, but in this article, I promised to share only ideas that will drive fast results. That’s why I suggest the following practical exercises.

Present the idea of “KPI freedom” to your team. Allow (and obligate) each member of your team to select 1 metric that he/she wants to use as a key one. This metric should be relevant both – in the context of the company’s overall performance and in the context of a person’s daily job.

Be prepared for some interesting and unexpected discussions provoked by the different ways people see their responsibilities and their impact on the overall performance. Take a chance to better explain where the company is aiming and how top managers plan to achieve the goal. A strategy map is a good catalyst for such discussions.

Use strategy map to support discussions about current performance and the ways to improve it

View 5 KPIs Tips Demo Scorecard online

Such discussions will be more productive if there is someone to explain the difference between the process and the result metrics, as well as the difference between leading and lagging metrics.

5. Visualize performance figures

Do it without any additional comments or explanations, just visualize 1-2 important metrics on a big screen that your team will see each day. Make sure you show the current performance and the historical trend.

Visualize important KPIs on the big screen

View 5 KPIs Tips Demo Scorecard online

I would keep it in this format for a while. If you are lucky, your team will soon start asking about the numbers, what they mean for them, and if/how they can contribute. Then, further discussions can be supported by strategy maps and more detailed dashboards. Use professional strategy execution software, like our BSC Designer, to automate some routine aspects.

These were 5 actionable ideas for the KPIs. I hope you found at least 1 that you will try. Feel free to share your experience in the comments.

Use 5 KPIs Tips Demo Scorecard project discussed in this article as a starting template for your own scorecard! Access this example project online or download .BSC project file for BSC Designer PRO.

View 5 KPIs Tips Demo Scorecard online

Spreadsheet vs. Specialized Scorecard Software

$
0
0

When a company wants to build and automate a business scorecard, it decides between good old Excel and specialized software. Spreadsheets (like MS Excel) doesn’t require any long training and are normally installed on many computers; at the same time, professional scorecard software provides some attractive functions, but implies additional cost.

KPI scorecard in spreadsheets like Excel vs. KPI scorecard in specialized software: PROs and CONs

The purpose of this article is to analyze the case where Excel wins and where the specialized software might be a better choice. If you have any additional ideas that will help business professionals to solve a dilemma, feel free to share it in the comments.

Where Excel wins

A spreadsheet (like MS Excel) is an excellent business tool. We can find it on many computers and it is also available in the Cloud. When it comes to the scorecards/dashboards/KPIs, it has certain benefits and application areas.

1. No need for additional investments

If you don’t have a budget for any new software, then Excel is an excellent choice for an automation task. In a few clicks, one can build a basic scorecard with all the necessary details for the KPIs, including target values, initiatives, and business context. With some tricks a basic scorecard in Excel can be created even faster.

2. Single-user scorecard

If a person has a “black belt” in Excel and he/she will be the only user of the scorecard, then Excel is also a good choice. Use of the formulas, tabs, and cross-links will help to present all possible performance data and analyze it.

3. Creating a prototype

There is no “one size fits all” performance measurement and management solutions. Before investing in automation software, it’s a good idea to try various approaches and understand which one fits better to the needs of the organization. Spreadsheet software is a good test ground for such experiments. The prototype scorecard can later be moved to specialized tools like some of our users did.

Risks of having scorecards in Excel and how to avoid them

Now, let’s focus on some typical risks of having a scorecard in a spreadsheet. Some of them were mentioned by our users in the case studies.

1. The risk of spaghetti-style scorecard

While any specialized scorecard software dictates certain approaches to the scorecards, the spreadsheet gives us absolute freedom. In some cases, the result of this freedom is a spaghetti-style scorecard with many cross-links between hundreds of metrics and several tabs. It probably will work for a time, but the next actualization might become a nightmare. If you decide to use a spreadsheet, make sure you keep the structure of the KPIs simple.

2. Historical data is hard to manage

How does the customer retention change over time? Why are sales high this June? Do we grow faster than the market? Analyzing trends is a great source of business insights. The problem is that the spreadsheets were simply not designed to keep historical data.

Off course, there are some turnarounds like cloning the column before entering new data, keeping historical data on a separate tab, or in a separate spreadsheet. These tricks will work on a small scale, but for larger scorecards, the spreadsheet will soon become a huge monster that makes it hard to analyze performance over time. Think about the way historical data will be stored beforehand.

3. Strategy map is frozen

A good business scorecard should include a strategy map that explains the context behind the KPIs. Those who create scorecards in Excel can use build-in drawing functions or create a strategy map in the software for the presentations, like in Power Point.

The visual picture in this case might look very professional, but changing any detail will be a headache. That’s why those visually appealing strategy maps normally remain untouched until the next annual performance review. One way to win this game in Excel is to replace the visual map with a data table or text-based map, making it less attractive, but more editable.

4. Time consuming KPI normalization and weighting

In most cases the values of the indicators are measured on different scales, and for the purpose of further analysis, they need to be adjusted to the common scale. For example, if the “email response time” indicator is measured in hours, it needs to be compared with the “satisfaction rate” indicator measured in %, and then we need to normalize “email response time,” for example by presenting its value on the [0..24 hours] scale, and calculating its performance respectively.

Few weeks after the implementation the end users will probably actualize their requirements. The typical ones are:

  • The measurement scale for the indicators can change over time
  • Consider cases like “less value means better performance”
  • Indicators might contribute to the overall performance with the different weights

It’s not a rocket science, and the math is simple, but it is a time-consuming task that can be easily automated.

5. The need to agree on the workflow

Most business professionals are familiar with Excel, so there is no need to train them for the basic operations. However, Excel is not a tool specialized in scorecards, so it doesn’t provide any fixed workflow for the scorecard creation and data entry. Organizations need to define and communicate to the teams how to use a scorecard-related workflow: how to add new KPIs, how to update and validate data, how to reflect changes on the strategy map, how to report on the performance, etc.

Where specialized scorecard software wins

With a specialized software users can expect automation of various aspects of the business scorecards. In the beginning any automation tool will provide a framework to build a scorecard, describe KPIs, and enter performance data.

1. Multi-level KPIs

Imagine a situation when you need to measure “Customer satisfaction, %” that correlates with the “Response time” and “Response quality,” and those two indicators need to be further drilled down. Such multi-level structure is possible in Excel, but maintaining it might be difficult. With the automation software, the multi-level scorecards are much more user-friendly.

2. Strategy map with cause-and-effect links

Unlike presentation software, most automation tools for the scorecards can build a live strategy map where the current performance data is visualized. Some visually appealing templates are already available in the tool, and even users without any design skills can create professional maps from scratch.

3. Team work and access management

Under the umbrella of “team work,” automation software allows you to maintain data in the Cloud, assign access rights to the scorecard and indicators, and send notifications to the team members.

All this is doable in Excel, for example, by placing a spreadsheet in the Cloud or by exchanging emails with attached files one can achieve the same result, but by spending much more time.

4. Keeping scorecard up to date

Specialized automation tools will make data actualization easier, and in many cases, will help to automate the data entry by fetching required information directly from the database.

5. Cascading/alignment

Business scorecards are not for the top managers only. The important business goals need to be aligned with the goals of other business units, and respectively those business units need to be actively involved (in practice, there are different ways how organizations do this). The specialized scorecard software will provide their users with one or another way to do cascading.

Check out 16 free examples of the Balanced Scorecards with KPIs created with BSC Designer software
Check out 16 free examples of the Balanced Scorecards with KPIs, strategy maps, and dashboards created with BSC Designer software.

Conclusions

Spreadsheet software like MS Excel is a good choice for one-user business scorecards with few indicators. It helps to play with the data and sort processes out before starting to use specialized software. Maintaining and sharing large scale scorecard is time consuming with spreadsheet software.

Specialized scorecard tools like BSC Designer require additional investment in the form of the subscription costs. Such tools were designed with a certain workflow in mind, and will help to automate many routine tasks like entering data, building strategy maps, sharing scorecards, reporting, and cascading.

  • The good thing is that one can try most of the professional tools for free, play with real data, and if something doesn´t work well, export data back into Excel.

I invite readers to share their stories about using scorecards in Excel, migrating from Excel to the specialized software or backward, or from the professional tools to the spreadsheet in the comments.

VIP Training: Managing and Improving Employee Engagement – Lisbon, Portugal

$
0
0

Business Scorecard and KPIs meeting in Lisbon, Portugal with BSC Designer

The VIP Training “Measuring and improving employee engagement” is a day-long hands-on training session designed with the needs of HR specialists in mind.

Date: 

  • 16th November, 2017, Lisbon, Portugal

Training description:

High employee engagement is reported as one of the most important factors of the overall business performance.

  • Engaged individuals do their job better, require less management efforts, achieve excellence in the area of the responsibilities and help a company succeed.
  • Disengaged employees slow down the organization, require inappropriate investment in their training and management, and finally lead an organization to mediocre performance results in the market.

According to the Gallup research just 13% of employees in companies all over the world are engaged. For sure there are companies that do much better. Employee engagement will be the main theme of this training:

  • In Block 1 we will discuss what employee engagement is, why it is important in the business context, and how we can quantify and measure it. In this way, we will be able to support all further improvement with hard performance data driven by appropriate KPIs.
  • Block 2 of the training was designed to show the possible improvement points. We will take a typical HR training as an example, and discuss how we can shift a focus from managing the training as a process to managing the real outcomes of the training.
  • While all organizations and their cultures are unique, there are some common patterns that impact on engagement. During Block 3 of the training we will discuss tools and methods that will help your organization to focus the efforts of top management and HR on the drivers of the employee engagement.
  • Training learning results will be summarized in Block 4 of the training. We will give you 5 actionable ideas that you will be able to implement when back in your office. These ideas will help to drive measurable improvements in the context of engagement.

Training program

  • 8:30 Registration
  • 9:00 Block 1. Measuring employee engagement. How to measure employee engagement? What KPIs to use? The most important challenges with KPIs and how to solve them.
  • 10:40 Coffee & Networking
  • 11:00 Block 2. Shifting a focus to the engagement. Shifting focus from efficiency and low engagement to the effectiveness and high engagement; using KPIs for training as an example.
  • 12:30 Lunch break
  • 13:30 Block 3. Improving engagement. Using a strategy map to engage employees and better communicate a strategy.
  • 15:00 Coffee & Networking
  • 15:30 Block 4. Fast results. 5 easy to implement KPI-related ideas that drive immediate improvement in the team engagement.
  • 17:00 Final note

Trainer:

Aleksey Savkin. Strategy and KPIs Scorecard Expert (LinkedIn) is helping companies to better formulate their strategies and make the process of strategy execution more tangible with KPIs. His areas of expertise are Balanced Scorecard, Key Performance Indicators, business performance management. Aleksey is a frequent speaker at conferences; the author of a number of articles and books on Balanced Scorecard.

New book by Aleksey: 10 Step KPI System will be presented on the training days.

Prices:

  • choose your plan

  • Pre-event webinars and their recordings
  • Post-event access to the slides and audio recordings of the sessions
  • Hard copy of "10-Step KPI System" Book
  • Participation in the event in Lisbon
  • Coffee & Networking, Lunch
  • 2 hours of post-event private consultations
  • ON THE FLY

  • 312 EUR

  • Early bird price ends 15th August, 2017; regular price is 520 EUR.
  • yes
  • yes
  • yes Postal delivery
  • no
  • no
  • no
  • VIP

  • 510 EUR

  • Early bird price ends 15th August, 2017; regular price is 850 EUR.
  • yes
  • yes
  • yes Signed during the event
  • yes 16th November, 2017, Lisbon, Portugal
  • yes
  • no
  • PREMIUM

  • 912 EUR

  • Early bird price ends 15th August, 2017; regular price is 1520 EUR.
  • yes
  • yes
  • yes Signed during the event
  • yes 16th November, 2017, Lisbon, Portugal
  • yes
  • yes Meeting 17th November, or Skype call later

European VAT might be applicable to the prices. For business purchases click on the “Buy Now” button, check the “Business purchase” checkbox, and enter the VAT ID of your company.

Training language: English


Free webinar: 5 Ways to Quickly Improve Employee Engagement

$
0
0

5 quick ways to improve employee engagementOn air: 17 July, 2017; 2 p.m. EST

Employee engagement is one of the most crucial factors of high business performance. Research by Gallup showed that only 13% of employees in the world are engaged. What about the rest? They are “disengaged” or “actively disengaged…”

What can we do about engagement?

  • Can we quantify and measure it? What KPIs should we use?
  • Can we improve it? What tools will help?

We invite HR professionals and CEOs to attend a free webinar “5 Ways to Quickly Improvement Employee Engagement.” During this webinar, we will discuss two important topics: how to measure the employee engagement, and once measured, how to improve it.

IMPORTANT: At the end of the webinar, we will announce an Employee Engagement Training that we will be doing November 16th in Lisbon, Portugal with an exclusive super early bird offer for the attendees of the webinar.

Useful links

Super early bird

This is a super early bird offer for the VIP Training: Managing and Improving Employee Engagement. For more details about the training visit its home page. These super early bid prices are valid only until 21th July, 2017.

  • choose your plan

  • Pre-event webinars and their recordings
  • Post-event access to the slides and audio recordings of the sessions
  • Hard copy of "10-Step KPI System" Book
  • Participation in the event in Lisbon
  • Coffee & Networking, Lunch
  • 2 hours of post-event private consultations
  • ON THE FLY

  • 234 EUR

  • Super early bird price ends 25th July 2017. Early bid price is 312 EUR, regular price is 520 EUR
  • yes
  • yes
  • yes Postal delivery
  • no
  • no
  • no
  • VIP

  • 383 EUR

  • Super early bird price ends 25th July 2017. Early bid price is 510 EUR, regular price is 850 EUR
  • yes
  • yes
  • yes Signed during the event
  • yes 16th November, 2017, Lisbon, Portugal
  • yes
  • no
  • PREMIUM

  • 684 EUR

  • Super early bird price ends 25th July 2017. Early bid price is 912 EUR, regular price is 1520 EUR
  • yes
  • yes
  • yes Signed during the event
  • yes 16th November, 2017, Lisbon, Portugal
  • yes
  • yes Meeting 17th November, or Skype call later

Some slides before we start

Although it is called “Employee Engagement,” the problem is NOT in the employees! The problem is in the business systems!

How to measure employee engagement?

Balanced Scorecard for Small and Medium Enterprises – Interview with Ignacio Castillo

$
0
0
Ignacio Castillo, General Manager and Founder of Demsa Consulting, a company located in Mexico that helps its clients to implement tools for the measurement of strategy using Balanced Scorecard methodology.

Ignacio Castillo, General Manager and Founder of Demsa Consulting.

Today we are going to speak with Ignacio Castillo, General Manager and Founder of Demsa Consulting, a company located in Mexico that helps its clients to implement tools for the measurement of strategy using Balanced Scorecard methodology.

… we should not make a large number of indicators to achieve an objective, since in the end we will focus only on measuring and not in complying with the strategy outlined and its objectives. Ignacio Castillo.

Aleksey: You created DEMSA in 2003. Why did you decide to work on the strategy subject?

Ignacio: First, I will tell you that I work in this because I lived as an employee. The problem is working in a company without strategy, and later, this same company decided to implement it and measure it, and I could see the enormous difference that exists in a company that only endeavors to work for financial results without thinking that these are the effect of many causes.

Aleksey: We can see that there is a lot of interest in Balance Scorecard methodology in Latin America. Which companies need a Balanced Scorecard? How can you describe a profile of your customers?

Ignacio: I am convinced that the companies that most need to implement the Balanced Scorecard methodology are small and medium enterprises (SMEs).

The profile of the clients are small and medium sized companies that have an organizational structure, in other words … they have well defined the hierarchies and the roles of the collaborators. They also have a strategy or at least a SWOT analysis that allows them to know where they want to go and how they will do it, and this allows us to implement the Balanced Scorecard methodology. On the other hand, if the company does not have a strategy but knows where to go, we help to develop it and of course to measure it

Aleksey: How do you see the situation with the subject of strategy in Mexico? In the context of strategy … what is the most urgent problem that organizations must solve?

Ignacio: The most serious problem that I see in my country is that the strategy is only managed in the top management of the company. I always say that the companies have two worlds, the corporate and the operational, where the former does not communicate its strategy to the second one. Therefore, they do not have their objectives connected and as a result, it is a company that does not advance because each side pushes in a different direction.

Aleksey: Although Balanced Scorecard is a methodology to execute a strategy, there are many organizations that focus on their measurement part (e.g. indicators). What do you think about this situation, what do you recommend to your customers?

Ignacio: That is true, at the beginning most of the clients with whom we worked understand the situation that way, but as we develop the implementation, the perception changes, and they now can see what the strategy is measuring through objectives, goals and indicators.

  • The recommendation is to understand from the beginning that the indicators are neither objectives nor goals, and you must go deeper into the subject and be very clear with your clients.

An indicator is a generator of results for a goal.

  • Another recommendation is that we should not make a large number of indicators to achieve an objective, since in the end we will focus only on measuring and not in complying with the strategy outlined and its objectives.

An indicator is something that can be counted and compared; it provides evidence of the degree to which a goal is achieved for a given time. This last explanation shows that you have to work hard to implement a BSC.

Aleksey: There are 6 steps on the DEMSA website to deal with strategy problems. How do they work?

Ignacio: Basically, we find the steps to implement the methodology here, it is clear that within the evaluation we can find out if a client is ready for the implementation of a Balanced Scorecard or not.

Aleksey: Step 6 of the process is automation. I suppose that among others, you recommend our BSC Designer software… For what kind of clients is this solution recommended? Which version do customers prefer in Mexico, in the Cloud or desktop?

Ignacio: I must say with great pride that the only tool we work with is BSC Designer and we implement it with all our clients, and the version they prefer is in the Cloud.

Aleksey: In many cases the most difficult thing is to start. What can you recommend to companies that want to test Balanced Scorecard methodology?

Ignacio: Let them investigate a little to understand the methodology, then they have to be willing to work in the implementation, and first of all, they should define their mission and vision.

Aleksey: How can your customers measure the success of the implementation? Are there any typical KPIs to confirm the improvements?

Ignacio: It is measured by the achievement of sales and income goals, as well as the staff training hours, and customer service.

Aleksey: What kind of business can DEMSA help in? How can they contact you?

Ignacio: Business for small and medium companies. Our website is: demsaconsulting.com.

Download BSC Designer PRO for Windows

$
0
0

Also, I’d like to schedule a live demo

We will follow up with you with lessons about the Balanced Scorecard. Our goal is to teach you key ideas and show you how these ideas can be automated with BSC Designer.

Run downloaded file

The downloaded file will be signed by a Kitonik s.r.o. publisher certificate as on the screenshot above.

Excel is a Good Tool to Initiate and Prototype a Balanced Scorecard – Interview with Juan Carlos Aranibar

$
0
0
Juan Carlos Aranibar, a Balanced Scorecard expert based in Bolivia, who is officially certified by The Palladium Group.

Juan Carlos Aranibar, a Balanced Scorecard expert based in Bolivia, who is officially certified by The Palladium Group.

Today, I want to share with the readers an interview with Juan Carlos Aranibar (LinkedIn, Prezi), a Balanced Scorecard expert based in Bolivia, who is officially certified by The Palladium Group. His academic background includes studies in IT, Business Administration and Finance. Besides being an international lecturer and consultant in Business Intelligence and Balanced Scorecard around Latin America, his expertise covers business performance models for the mining industry for more than 20 years. His book, “Management Information Systems for Business Performance Management, the Convergence of Business Intelligence and Balanced Scorecard,” has been sold in more than 8 countries, including USA and Spain.

Aleksey: Juan Carlos, thank you for this opportunity to ask you some questions about the Balanced Scorecard framework and the partnership with BSC Designer.

How did you get started in the area of performance management and specifically with the Balanced Scorecard framework?

Juan Carlos: A long time ago, as the leader of the IT area in a mining company, I felt the need to monitor how well/bad we were doing in compliance of our IT plan aligned to our strategic plan. In addition, the corporation suggested for us to manage some measures regarding budget use: IT service, infrastructure availability and projects.

In this way, I started to do research on the performance models.

The Balance Scorecard called my attention. It was provided as a structured way to organize key performance indicators, performance drivers and strategic initiatives.

Also, it helped to track value creation through the conversion of intangible assets into tangible ones using a strategic map that was showing the cause-effect relations of objectives. In the case of IT, this was even more important because it became critical to understand its contribution to the company.

Aleksey: Why do you think the Balanced Scorecard framework is so popular among business professionals, especially in Latin America countries?

Juan Carlos: In Latin America, as it can be supposed, big companies are similar to medium ones of the developed economies. So, in terms of the number of cases, the scenario for organizations are mainly based on small and medium-sized companies which have the understandable intention to grow, to be global, grow financially, break into unknown markets, optimize processes to reduce costs, apply best practices or standards, or finally to survive. This way, professionals are very interested in organizational performance tools based on effective methodologies, which are easy to understand and to implement and are within easy reach.

Aleksey: What are the most important goals that organizations want to achieve by implementing strategy execution framework?

Juan Carlos: I think making things happen in a chain of conditions.

One of the reasons for failing strategy execution is the lack of a formal methodology and wrong tools.

In addition, problems regarding the implementation of a performance model. Frequently, it is created formally, with a focus on the technological tools. Having a simple process for implementation helps a lot. Somebody stated that a KISS focus guarantees an effective implementation, it means: “keep it short and simple.”

Aleksey: According to your experience, what are the key factors of a successful Balanced Scorecard implementation?
Juan Carlos:

  • The first factors are related to the use of an appropriate tool representing a performance model. It should include linked objectives and point towards value generation in terms of tangible assets.
  • Another factor regards the usage of the right key performance indicators (or lag indicators), but mainly, the right performance drivers (lead indicators) that determine the behavior of the lag indicators.
  • And the last factor refers to the human factor, because an appropriate engaging of the main actors of the model, including the top management sponsorship, is very important.

I could formulate an implementation success summary: use the right tool to represent the right model to the right participants.

Aleksey: If a strategist in the organization had limited resources, what would be the 2-3 simple things that he or she could do right now to get the strategy execution on the right track?

Juan Carlos: Budget is always an important thing to consider in the process of having a good scenario of strategy execution. A strategist with limited resources should pay special attention to acquiring a low-cost tool, destining specialized staff (probably one representative is enough) and taking the strategic planning and controlling processes very seriously. This is a way to change organizational culture proactively towards an inherent performance management in the organization.

Aleksey: What about specialized automation software? Is there a real need for it or an organization can solve their needs using MS Excel Spreadsheets?

Juan Carlos: Excel is a good tool to initiate and prototype a Balanced Scorecard methodology. In the last versions are available complementary features to automatize information modelling, extraction and visualization. However, there is no way to manage strategic maps as native, and other tasks that deal with advanced dashboards. In fact, Excel is not a tool to manage dashboarding capabilities in a sophisticated way. It is possible to draw a map linking bubbles or circles, but it is complex to make interaction with them because macros and other workarounds are needed, which means it is not an easy job to understand and maintain. For this reason, a specialized software is a better option, especially when a performance culture is a paradigm that an organization is trying to adopt.

Aleksey: Different clients need different tools to address their needs… If what cases do you recommend BSC Designer tool? Who will benefit the most from its implementation?

Juan Carlos: BSC Designer tool is suitable to those cases where the organization wants to jump to an upper level of performance management using low budget, but specialized features like:

  • strategic maps creation and interpretation,
  • easy linking to information sources,
  • appropriate managing of dashboards with many visualizations for key performance indicators,
  • coloring,
  • simulation and forecasting,
  • and so on.

Lately, Cloud computing has been the option to facilitate many technical issues. Balanced Scorecard tools are not the exception, and in the case of BSC Designer Online, the service is quite efficient and enough for some scenarios. But if the organization wants to have owned the software in their installation, the desktop option is also effective.

Aleksey: After the implementation of the strategy execution framework: how quickly can the organization expect to see the improvement? How should they measure the success of the implementation?

Juan Carlos: Like all stuff related to organizational strategy, good news will come later. It could take months or even years to feel the impact of good data-driven decisions. The real situation of strategy execution framework is that the return on investment is quite hard to determine because it is reflected in: financing and investing decisions, market and development products, process improvements, better intangible assets management which means more value in tangible assets, and many more. These benefits are a result of translating better decisions in economic impact.

Aleksey: What companies in Latin America are already doing the Balanced Scorecard well?

Juan Carlos: There are a lot, but to be honest, most of them are applying just a part of the complete methodology. For example, there some companies with a good strategy map, but forgetting the lead indicators, or there are cases with a good set of lag and lead indicators, but without a portfolio of strategic initiatives; and so on. It is demonstrated that in a scenario with some absent elements, is hard to understand the real contribution that the methodology could give to the performance management system in the company. I know about many industries like mining, oil, food, financial services, retail, educational institutions, pharmaceuticals laboratories, healthcare, telecom, public institutions, NGOs, international cooperation, construction, power energy, insurance, tourism, and many others. In fact, I applied advisory work to many of these cases.

One of the latest versions of the Hall of Fame of Palladium Group includes formally these latin organizations: Banco Estado, Unibanco, Compartamos Banco, Chilectra, Federación Nacional de Cafeteros de Colombia, Megasalud, Delta Dental, Unimed, Minera Los Pelambres, Polibrasil, Cablevisión, Atento, Brasil Kirin, Grupo Modelo, and Cinépolis. Some of them are quite big in the latin context.

Aleksey: What is a profile of your typical client?

Juan Carlos: Business issues related to performance are present in all kind of organizations and business functions. I have worked from top strategic level with big and small organizations through performance model design for projects and operative teams and employees.

However, I realized at the beginning of my incursion on this paradigm that areas like HR and Sales were the most interested in applying the Balanced Scorecard. Also, I have developed a lot of Balanced Scorecard models and their elements for extractive industries, like mining and oil/gas. To be honest, I could see very low cases where the methodology has been requested to implement as a top management initiative, which should be regular. It is very common that BSC projects comes from specific functional area and then irradiate to all organization.

A typical client has a scenario with a lot of unintegrated lag measures, does not know about performance drivers or lead indicators and value generation with causal model is unknown. On the other hand, Business Intelligence and Business Analytics are frequently obviated or simply discarded, with the corresponding effects of a risky, tedious and time-consuming manual job.

Aleksey: If our readers would like to get more help with the Balanced Scorecard, what services can you offer them?

Juan Carlos: I am a consultant around Latin America in many fields, but my specialization touches: Performance Management, Balanced Scorecard, Business Analytics and Business Intelligence, Business Process Management, and Strategic Planning. One of my most valuable strengths is my knowledge about the right convergence that an organization should apply using performance models and managerial information tools.

How-to Measure Innovations with KPIs

$
0
0

One of the challenges that business owners face when planning a business strategy is measuring how innovative an organization is. Learn how to approach this measurement challenge with KPIs. 
How to find good KPIs for measuring innovations

The lagging part of the innovations is relatively clear, we can measure the number of innovative initiatives that became successful in some time or measure their financial impact. But what about the leading part? How can the leading metrics can be formulated in the domain of innovations? How can we predict that the company will create these innovations?

What company will never innovate?

Let’s formulate the opposite question:

  • What is a profile of a company that most likely won’t be able to innovate?

These are the companies where:

  • All new ideas are rejected,
  • The barrier for approving new ideas is too high,
  • The bureaucracy dominates over common sense,
  • Where short term profits are more important that long-term value for the customers,
  • Where employees are always busy with firefighting and simply don’t have free time to think about something new, and
  • Where informational silos limit the exchange of information between the departments…

We can go ahead and list more behavior patterns that have negative influence on the innovative potential. My point is that the innovative companies will do exactly the opposite things. Do you need to measure how innovative your company is? Quantify and measure those behavior patterns.

Don’t forget about the stakeholders:

  • Who might suggest an innovation? Employees, partners, clients?
  • Are the members of your team using your product or service as end-users?
  • How actively can your team experiment?

There are always some good ideas out there, the question is if you team has the time and resources for the experiments.

How innovative is your environment?

The basic metrics might be:

  • The number of ideas suggested by the team over a period of time
  • The percent of the ideas turned into experiments
  • Dedicated time for the experiments

Where do those ideas come from? In the previous chapter [see 10 Step KPI System book], we agreed to divide inputs and success factors, but the inputs always correlate in some way with the success factors. What might be the inputs for the innovation?

  • Do the members of your team read the books in their domain, visit conferences?
  • Can we expect that someone who visited a conference can write down a list of 5 ideas that your team can try later?

That’s easy if someone watched the presentations and networked with colleagues!

Innovation funnel

Having discussed how the companies innovate (and don’t innovate) we can build an innovation funnel. It will be something like:

  • Insight > idea > discussion > experiments > prototype > product > commercial success of failure.

If you ask any entrepreneur about the number of his or her successful projects, you would hear something like 3 of 10 projects fail, 6 of 10 are poor performers, 1 of 10 is where we can achieve excellence. What do these numbers tell us in terms of innovation?

To be able to succeed with 1 project, your team will need to fail at least with 9 other projects.

And make sure your teams are really trying and not giving away some random projects as failures.

Innovations and rewards

Should we reward someone for generating good ideas? I would be careful with this. I shared my point of view on the financial rewards in the “Reward scorecard” article. And I believe that immediate financial motivation in this case won’t drive any good behavior. Focus on the non-financial ways to award the person. At least recognize his or her contribution to the idea.
10 Step KPI System Bookshot

Find more ideas in the new book

Aleksey Savkin, author of the book about KPIs – “10 Step KPI System. A time-proven approach to finding tailor-made KPIs for the most challenging business situations” where he shares his best practices for dealing with the most challenging business situations using KPIs. The book will be available on Amazon this summer, and is already available on Lulu

8 Ways to Get More Insights from Customer Surveys

$
0
0

Customer satisfaction, employee engagement, and product quality – all can be measured using surveys. In this article, we discuss 8 ways a business professional can improve their survey techniques to get more business insights with less efforts. This article is also available in Spanish.

8 Ways to Get More Insights from Customer Surveys

Here are the topics that we’ll discuss:

  • What are the advantages and disadvantages of the surveys
  • What are the alternatives
  • Why bad business practices look great through the survey prism
  • The problem of multiple choice questions and how to fix it
  • Survey checklist with recommended best practices
  • Some advice on how to present survey data on strategy scorecard

A quick overview of the surveys: advantages and disadvantages

Surveys are a great business tool. Many organizations use them to get some feedback from their customers.

Surveys help to cut costs of market analysis. Instead of thinking about sophisticated IT to track customer behaviour, an organization can simply ask their questions directly to the end users of their product.

The opposite side of the coin is that:

  • The results of the surveys are subjective
  • The data obtained is affected by observation bias (the way we formulate the question predetermines the way people will answer it)
  • The answers to the pre-defined questions ignore important contextual nuances
  • The free-form answers are hard to quantify

Probably the most dangerous drawback of the surveys is that their results can be easily manipulated. I’m not talking about an angry client who decided to give a “bad” rating to the customer service. I’m talking about the management team that unconsciously manipulates a survey on the early design stage by using multiple choice questions. Below we will talk in detail about this problem and how to avoid it.

Observation is an alternative to a survey

Do we have an alternative to the surveys? I discussed this in 10-Step KPI System book, the alternative is observation. Instead of interacting with the customers by asking questions, we could do what astrophysicists do with stars – observe without direct contact with the subject of observation.

Should we stop using surveys at all? No way! We need to understand the limitations of this tool, and learn to get the best possible results from using it.

Why bad business practices sometimes look great through the survey prism

On a late summer evening, you land at Charles de Gaulle Airport, France, and find out that your bank cards were blocked. After talking to a bank representative, you know that there was an IT error on their side, and that you won’t have any access to money on your bank account for at least one week until new cards can be mailed to you. They know your situation, and they care a lot, but instead of sending new cards urgently via FedEx directly to the hotel, they simply say “sorry” and promise to fix it as soon as possible. This is a bad business practice.

Some days later you get a call from the customer loyalty service of the bank. They want to know your opinion about the service provided to you recently. You are willing to let them know everything you think about their bank and explain how hard it was to survive without cards, but the format of the call implies that you answer the survey questions.

Let’s have a look at those questions:

  • “Was the call answered fast?”.. could be better, but yes, it was.
  • “How professional was the person who handled the call?” .. the bank representative was really professional; she responded calmly and explained in detail the reasons for the problem; she did not have a solution, but it obviously was not her fault, but the fault of the bank.
  • “Would you recommend our bank to others?” The way bank managed the situation was not acceptable, but there are of course some benefits of being their client. Should I answer here “Never again” or try to be more realistic and say, “Probably yes…?!”

You are willing to add some more comments, but on the other end of the line all fields of the survey are now completed and you hear:

  • “Thank you for your opinion. It is VERY important for us. Good bye.”

How will the results of the survey look on the bank’s dashboard? Depending on your answer to the question 3, the satisfaction indicator will be somewhere in the area of “excellent” or “good!”

The problem of multiple choice questions and how to fix it

There is one common thing about the questions asked – they all are easy to quantify. Actually, any multiple-choice question is already quantified. Let’s call them pre-quantified. It is easy to calculate the percentage of the clients who have chosen certain options, and then use an average of the three answers to get a “Customer Satisfaction Index.” Magic happens and managers have some data to use for the charts for the annual performance report.

Unfortunately, such an approach doesn’t give any clue to what customers liked, and what not, or what their challenges are. Customers don’t think about a company within 3 perspectives. They don’t think separately about “Response time, minutes” or “Customer representative proficiency.” They think about their problem and how easy it was to solve it.

Use open-ended questions to get more insights

With the described approach to the surveys, management will have a slight idea about the problem that the customer faced. A quick fix would be to add an open-ended question that requires a free-form answer.

Here is a real example. The open-ended question of one of our surveys was:

  • “What is your key challenge with the Balanced Scorecard?”

And here were the answers:

  • “I’m just looking how to get started”
  • “I need to understand how it will work for IT”
  • “I want to know how to transfer top level strategy to low levels”
  • “Getting buy-in”
  • “Internal perspective planning”

I think these answers are valuable for R&D and Marketing. For example, we can group them into the categories (users of BSC Designer have Initiatives for this, as described below), count the number of answers in each category, compare answers to the client profiles, and come up with some sort of strategy that will help to better satisfy the client’s needs.

Easy, right? Why don’t companies do this? Two reasons:

  • The open-ended questions are known factors of higher abandonment rate (so be careful with them);
  • Free-form answers are hard to quantify, as they need to be processed manually.

A checklist for better surveys

Using open-ended questions is a good starting point, but it is important to look at the problem from various sides. Here is a list of 8 ideas that will help you to design better surveys. Feel free to add additional thoughts in the comments.

  1. Focus on a few well-formulated questions. Twitter with its 140 characters is popular for a reason. Depending on the context of survey, the best number of questions is around 3-5.
  2. Suggest at least one open-ended question. The answers to such questions are hard to quantify, but at the same time they are the most valuable. Teach your team to read between the lines, and allow customers to go into the detail when it makes sense.
  3. Be visual. Look at Typeform for some ideas. At least some percent of the participants of your survey will appreciate good visuals and professional design. You will confirm it by observing a lower abandonment rate.
  4. Select good timing. Asking to fill in a customer satisfaction form when a guest checks out from the hotel and needs to catch a flight is not the best idea. Find the best time to do surveys. For example, in the software business, users are more willing to share their thoughts about the product right after their current problem was solved.
  5. Let participants learn something new. Don’t just ask questions, engage with the participants of the survey. Avoid a boring design; avoid boring questions; try to teach something, not just ask. In one of the surveys we asked participants to select the KPI practices that they use – later we found out that the survey questions worked like an action plan for many of the potential users.
  6. Allow participants to ask questions. You need to be creative to get the questions from the clients. You cannot simply add a field: “You can ask your questions now” – it doesn´t work. Try asking an open-ended question that will make customers think in the right direction. We did it by asking clients “What’s your biggest challenge with…?” On the next step, we suggested entering emails to get the answers. Around 23% of the participants shared their challenges and shared their emails to get an answer. That was useful to learn more about their needs, and in the most cases we could answer by simply sending a link the relevant best practice article.
  7. Have some prize at the end. It should not be something expensive. You are not buying a client’s time (it is worth much more). You goal is to give proof that client’s opinions matter. Give some bonus points to their loyalty card, promise a good discount for a front-end product. In one survey, we gave a 75% discount, the front-end product generated almost no profit for us, but the value of new hot leads and the information obtained was high. “Answer the questions to see the results” is also a good motivation to get to the end. Combine ideas 7 and 5 – build a quiz-style survey.
  8. Track abandonment rate. It is a good indicator of the quality of your survey. People can abandon for many reasons: irrelevant questions, wrong profile of a participant, bad time to ask. Do a/b tests under different conditions to find out what works better in your case. Don’t forget to track the Participation Rate. If you have 20+ questions many will drop the survey without starting.

Presenting survey data on strategy scorecard with BSC Designer

Conducting a survey is just a starting point of your research. In the best-case scenario, the results of the surveys will be carefully analyzed and presented on the strategy scorecard. Here are some recommendations for the clients of BSC Designer.

Most likely you will use some 3rd party tool to conduct the survey. When you need to get the data to your strategy scorecard, I’d recommend the following approach:

  • Open a relevant scorecard or create a new one
  • Create a business goal. For example: “Build a better customer service”
  • Assign a person responsible for the business goal. This person will receive notifications about upcoming update intervals, and the new initiatives aligned with the goal.
  • Create a new indicator – “Customer satisfaction” and align it with the business goal. Assign appropriate an update interval for the indicator (can be monthly or quarterly for example).
  • Enter survey results data into the “Customer satisfaction” indicator. It’s normally just one number, so you can do it manually. If there are more indicators you can import via Excel or automate via RESTFull API.
  • If you are building an index indicator that is powered by a set of indicators, consider setting ¨weight¨ for the child indicators.

Use weight to differentiate the importance of indicators

  • Use “Initiatives” for the business goal to write down the ideas generated by the open-ended questions. For example, you can sort client’s opinions into several groups, create an initiative for each group, and add the details in the “Comments” field.

Improvement ideas in BSC Designer formalized in initiative

In BSC Designer you will also find a data series function. It can help with surveys and will be more suitable for the cases when the performance of certain goal is estimated by several experts using different evaluation criterion (indicators).

A note to the users of BSC Designer

We are now working on a prototype of the survey tool that will help users of BSC Designer to conduct short online surveys, and later update their scorecards with fresh data automatically.

For example, think about this scenario:

  • Your business system regularly sends your customers an invitation to participate in the customer satisfaction surveys.
  • The answers to the survey are stored in the survey tool and can be automatically transferred to the selected indicator in BSC Designer Online.

If you have some thoughts on the topic, or want to be among first users to beta-test the new survey tool, please follow this link.

Let’s continue the discussion

What survey-related tricks worked for you? Can you recommend a useful tool to conduct a survey, determine survey questions, prize/motivation to finish the survey? Feel free to share your thoughts in the comments.

Survey Tool and BSC Designer

$
0
0

We are now working on a prototype of the survey tool that will help users of BSC Designer to conduct short online surveys, and later update their scorecards with fresh data automatically.

For example, think about this scenario:

  • Your business system regularly sends your customers an invitation to participate in the customer satisfaction surveys.
  • The answers to the survey are stored in the survey tool and can be automatically transferred to the selected indicator in BSC Designer Online.

If you have some thoughts on the topic, or want to be among first users to beta-test the new survey tool, please fill in this form:

[contact-form-7]

Mind Mapping for a Strategist with BSC Designer

$
0
0

Mind maps are an excellent technique used to outline and discuss various ideas. What about using mind maps for ideas about strategy? Is there a place for mind mapping when a strategy map is created?

Catch random ideas with mind map and present business goals with cause-and-effect logic on a strategy map.

View Scorecard with a Mind Map online

In this article, I’m going to share my experience, and I invite both strategy map and mind map practitioners to share their thoughts in the comments.

What’s the difference between strategy and a mind map?

A mind map is a flexible tool mainly used to outline ideas. For the best effect on the cognitive skills, it is widely recommended to use handwritten text, natural links, and graphics.

A strategy map is normally a one-page diagram where the business goals are mapped in 4 perspectives. The cause-and-effect logic on the map shows how an organization plan to execute its strategy.

Let’s do a short compare and contrast analysis of both techniques.

Mind MapsStrategy Maps
What do we map?Ideas, associationsBusiness goals
How do we connect objects?By following a natural flow of ideas including cross linksBy following a cause-and-effect logic; the direction is bottom-up – from capabilities to creating a value for the shareholders
Mapping toolsA spider map diagram with keywords in the nodes; cross branch connections; active use of graphical meansA table diagram with goals maps in several perspectives; aligned metrics and initiatives
Scale of the mapVary in size; the use of nodes helps to keep map readableNormally a 1-page map + optional 1-2 pages of supporting documentation
Practical useWide range of applications mainly focused on outlining ideas for better understanding and natural-flow explanationDescription of the strategy, ideally should answer the questions about where the organization wants to get and how to get there

Should a strategist use a mind map?

Mind mapping for a strategy

It might look like all strategy-related activities happen exclusively on a strategy map… A company’s top managers are supposed to come up with an excellent “strategy” and present it on the map. In reality, it doesn’t work in this way.

Any idea passes a long way from an “insight” stage to the “strategic hypothesis” or a “business goal.” What method can stimulate generating more insights about strategy? Anything from a blank page of paper, Newton’s apple, meditation to mind/process/concept mapping, SWOT, PESTLE – anything that has the power to support creative thinking. On our website, we have an “Executive’s toolkit” category where we discuss different tools that can help.

Do you need more insights that will be converted into an excellent strategy? Why not try mind mapping?

Mind mapping with BSC Designer

This part of the article will be more interesting for the current and future users of BSC Designer. I guess you know very well that this software helps to create professional strategy maps. On the same “Strategy map” tab one can create additional maps, including a mind map.

BSC Designer is not a software for mind mapping, but it has a very interesting feature that helps one to combine mind and strategy maps:

On the map, you can use business goals and KPIs from your scorecard.

Let’s say that we have a typical customer-related goal on the map, for example, “Improve customer support.” Our plan is to “Implement better agent training” (you can see it on the map in the form of the initiative).  We know what metrics we are going to use. The leading metric will be “Agent training, hours” and the lagging metric will be “First call resolution rate, %.”

Improve customer support goal on the map with an initiative, leading, and lagging KPIs

View Scorecard with a Mind Map online

Does our team have enough information to start working on this goal? How can we do better? Why not create an additional map and start catching some ideas?

I switch to the “Strategy map” tab and create an additional map using “+” button.

Adding additional map to the scorecard

The first thing to do is to add a copy of my business goal to this map. To do so I have “Add business goal” button. From the two suggested options, I’m interested in using the second one – “Add existing business goal.”

Add existing business goal to the map

I have a live copy of the business goal on my new map. It is live because any change of the aligned KPIs or initiatives, will be reflected on this map.

A live goal on the map

View Scorecard with a Mind Map online

Let’s do some mind mapping now.

“Improving customer support” … Let’s map here on the left the recent complaints from our customers: “Long waiting time; The IT system was not working; Support representative didn’t know the answer…” and here on the right are some thoughts about the ways to improve… “Define 20 most frequent cases and make sure every support representative knows how to answer” “Analyze why it takes so long to answer one query, can we improve or should we hire more people?” “What is happening with IT, who is able to diagnose and fix it.”

A business goal with some aligned ideas on the mind map

View Scorecard with a Mind Map online

On this stage, the ideas are scattered and for now it´s hard to use them and build a solid strategy. First, we need to discuss and test some of them. A simple mind map is an appropriate tool in this case. At any time, this map can be shared with other users or exported as a picture file.

Some of the ideas might be converted into the initiatives and can be aligned with the business goals. For example, the “20 cases” idea and the idea about researching problems with IT look like actionable initiatives. I’m adding them as an initiative for this business goal, assigning a person to be responsible, a budget, and the time needed to do it.

Additional initiatives aligned with business goal

View Scorecard with a Mind Map online

The business goal on the strategy map has all the details and is ready for execution. Still, I prefer to keep my mind map in the scorecard for some possible references in the future.

Final recommendations

  • Practice mind maps to catch ideas about business challenges, success factors, competitors, external conditions, strengths, weaknesses, etc. In early stage, the goal is to get more insights without caring much about the structure.
  • Pick the most promising ideas. Use a strategy map as a framework to present the ideas in the form of strategic hypothesis and business goals. Align the ideas with your overall strategy.
  • Use automation software like BSC Designer to manage both types of maps – the top view strategy map and mind map with the ideas. You never know when your strategy will need new inputs.

Do you use mind maps when generating ideas for your strategy or for your KPIs? Please share your thoughts in the comments.

Use Scorecard with a Mind Map project discussed in this article as a starting template for your own scorecard! Access this example project online or download .BSC project file for BSC Designer PRO.

View Scorecard with a Mind Map online

Event Feedback Form

$
0
0

How was the talk “Communicate strategy more effectively and engage workforce in company objectives” on SCIP Europe 2017?

5 Easy to Implement KPI-Related Ideas that Drive Immediate Results

$
0
0

We’ve recently gotten a comment to “10 Step KPI System” book:

“I have found some good ideas, but in our organization I simply don’t have enough political weight to try all of them…”

In this article, instead of focusing on all possible improvement tactics let’s focus on ones that are relatively easy to implement, but drive visible improvements in a short period of time. In a case of success, the person who suggested those tactics will gain some political credits and prepare ground for future improvements.

5 easy to implement KPI-related ideas that drive immediate improvements

1. Find metrics for the bottleneck

Among all possibilities, focus on those parts of the business system that are limiting your performance. Thinking in this way will help reduce the number of less useful metrics and focus only on those few indicators that are actually “key” for your business.

Sometimes this approach looks like fire-fighting and some long-term perspective might be ignored, but at least your team will be clear about where the priorities should be right now.

2. Identify change metrics

Knowing what is limiting your business is a good starting point, but what is even more important is to understand how to extend these limits. Look for the ways to change, and respectively find the metrics that will help to confirm that you are on the right track with the changes.

For example, delivery service might find out that their bottleneck is the number of trucks on the route. A change goal in this case might be switching some deliveries to a delivery service with drones.

You might argue that delivery with the drones is a significant innovation, and it’s hard to find something similar in our niche. That’s true, but at least your team will now know where to focus their innovation efforts, and what changes can drive significant performance improvements.

3. Show the power of funnel metrics

Many organizations have a goal of improving profits by X% next year. One of the ways to make this goal more tangible and actionable is to build a funnel model.

Funnel metrics for 3 levels in BSC Designer Online

View 5 KPIs Tips Demo Scorecard online

For example, if we are talking about a sales funnel, then the right questions can be:

  • How well is our business attracting potential customers?
  • How well is our business generating leads?
  • How well are the leads being converted into paying clients?
  • Draw a money/value/customer flow and use it to understand what can be improved. Small improvement on each level of the funnel will lead to significant improvement in overall performance.

Let me use some simple math to illustrate the power of funnel metrics. For example, we have a 3-level sales funnel with a 5% conversion ratio between each level. On the first level, there are 10,000 prospect customers (for example website visitors), then there are 500 qualified leads (for example, those who downloaded the white paper), then there are 25 sales. The overall goal is to increase sales by 20% up to 30 sales. One way to do this is to increase the number on the first level by 20%, but we can also work with the conversion ratios.

What change in the conversion ratios would give us a desired 20% increase? 20%? 10%? No! Actually, in this case we just need to increase both conversion ratios by 0.5%!

The good thing is that we can build a funnel model for any aspect of the business from sales to innovations.

4. Practice “KPI freedom” with a team

A lot was said about the importance of the culture in the organization, including the performance measurement culture. In my book, I talked about the ways to change the culture, but in this article, I promised to share only ideas that will drive fast results. That’s why I suggest the following practical exercises.

Present the idea of “KPI freedom” to your team. Allow (and obligate) each member of your team to select 1 metric that he/she wants to use as a key one. This metric should be relevant both – in the context of the company’s overall performance and in the context of a person’s daily job.

Be prepared for some interesting and unexpected discussions provoked by the different ways people see their responsibilities and their impact on the overall performance. Take a chance to better explain where the company is aiming and how top managers plan to achieve the goal. A strategy map is a good catalyst for such discussions.

Use strategy map to support discussions about current performance and the ways to improve it

View 5 KPIs Tips Demo Scorecard online

Such discussions will be more productive if there is someone to explain the difference between the process and the result metrics, as well as the difference between leading and lagging metrics.

5. Visualize performance figures

Do it without any additional comments or explanations, just visualize 1-2 important metrics on a big screen that your team will see each day. Make sure you show the current performance and the historical trend.

Visualize important KPIs on the big screen

View 5 KPIs Tips Demo Scorecard online

I would keep it in this format for a while. If you are lucky, your team will soon start asking about the numbers, what they mean for them, and if/how they can contribute. Then, further discussions can be supported by strategy maps and more detailed dashboards. Use professional strategy execution software, like our BSC Designer, to automate some routine aspects.

These were 5 actionable ideas for the KPIs. I hope you found at least 1 that you will try. Feel free to share your experience in the comments.

Use 5 KPIs Tips Demo Scorecard project discussed in this article as a starting template for your own scorecard! Access this example project online or download .BSC project file for BSC Designer PRO.

View 5 KPIs Tips Demo Scorecard online

Using SQL Database as a Source of Data for a Scorecard

$
0
0

In this training video we talk about setting up WebSQL indicators in BSC Designer Online that allow using external SQL database as a source of data for the indicators in the scorecard. The topics that we discuss:

  • Creating WebSQL indicator
  • Using update interval parameters in the SQL query
  • Updating the values of the indicator
  • Using KPI update interval to schedule automatic update
  • Testing WebSQL locally using BSC Designer installed locally

For more details check out the corresponding section of user manual.

An Educational Startup Tracking KPIs

$
0
0

Logo Personal VestibularesAn educational start-up called Personal Vestibulares, specializing in personalized preparation for top Brazilian universities, used BSC Designer to manage KPIs to track efficient learning. As a result of the implementation of BSC Designer, a shorter problem identification-analysis-solution cycle was achieved.

The challenge faced

The initial challenge was to define and track KPIs that would guaranty the differentiation of the organization and the delivery of the proposed value. It was planned to focus on the main measurement efforts on tracking:

  • Personalization,
  • Humanization, and
  • Efficient learning process.

The role of BSC Designer software

BSC Designer made it easy to input and analyze performance data. The implementation of the software forced all accountable managers to keep track of the desirable results and keep a log of all the important performance data.

BSC makes it easy to input and analyze data. That forces the discipline of all accountable managers not to lose track of desirable results.

Gustavo Yolle, CEO, Personal Vestibulares

The software helped managers to be focused on the strategy, e.g. review, and be able to improve it regularly. The cause-and-effect logic on the strategy map helped to:

  • Understand the reasons of the cases when the desired results were not achieved,
  • Find improvement points, and
  • Redefine the communication of the team.

Achieved results

After the implementation of BSC Designer the company could improve the response speed to the problems by two times. In the cases when something was not working, projects were not executed as expected, or when some team was losing the focus on the project, the software helped us to see problem on the level of performance data and fix it in an early stage.

An outline of the implementation

  1. Define success factors of the successful customer value creation
  2. Presenting success factors in the form of KPIs, e.g. personalization, humanization, efficient learning process
  3. Presenting company’s strategy on strategy map using BSC Designer software
  4. Tracking KPIs with BSC Designer
  5. Finding potential and actual problems
  6. Solving problems, redefining communications of the team

About Personal Vestibulares

Logo Personal VestibularesPersonal Vestibulares is an educational start-up specializing in personal preparation for top Brazilian universities’ admission exams. Learn more about Vestibulares at: http://www.personalvestibulares.com.br/

About BSC Designer

BSC Designer Logo - 150 x 150BSC Designer software is recognized by professionals from the education sector as a tool for strategy scorecard design and managing Key Performance Indicators. This software helps to create scorecards for the administration of universities as well as track and improve the performance of teaching process.

Among users of BSC Designer software are such universities as University of Alberta (Canada), The Ohio State University (US), Universidad Autonoma del Estado (Mexico), Huazhong University of Science & Technology (China).

Additional cases

Viewing all 184 articles
Browse latest View live